Seawater Reverse Osmosis (SWRO) Desalination Technology: Comprehensive Analysis of Latest Membrane Innovations, Capital and Operating Cost Economics, and Performance Optimization Strategies
Seawater Reverse Osmosis (SWRO) Desalination Technology: Comprehensive Analysis of Latest Membrane Innovations, Capital and Operating Cost Economics, and Performance Optimization Strategies
Reading Time: 31 minutes | Exchange Rate: 1 USD = IDR 16,600 (October 4, 2025)
Key Highlights
• Capital Cost Declining Trend: SWRO plant CAPEX ranges USD 1,000-2,500 per m³/day capacity (IDR 16.6-41.5 million), with 15% cost reduction for every doubling of cumulative global capacity demonstrating strong learning curve effects and economies of scale benefits[1]
• Operating Cost Competitiveness: Modern SWRO facilities achieve operating costs USD 0.39-0.66 per m³ (IDR 6,474-10,956 per m³) for medium-scale plants, with energy consumption 3-4 kWh/m³ representing 40-60% of total OPEX, significantly lower than thermal desalination alternatives[2]
• Advanced Membrane Technology: Thin-Film Nanocomposite (TFN) membranes achieve industry-leading 99.89% salt rejection rates while reducing both CAPEX and OPEX through extended lifespan 3-5 years and lower energy requirements, with membrane replacement accounting for 5% total water cost and 12% operating expenses[3]
• Energy Efficiency Improvements: Integration of Pressure Retarded Osmosis (PRO) with SWRO reduces energy consumption by 20%, while nanotechnology-enhanced membranes and AI-based monitoring systems decrease operational energy use up to 15% compared to conventional thermal distillation technologies[4]
Executive Summary
Seawater Reverse Osmosis (SWRO) represents the dominant desalination technology globally, accounting for over 65% of new desalination capacity installations and demonstrating superior economic performance compared to thermal distillation alternatives. SWRO employs semi-permeable membranes subjected to hydraulic pressure exceeding seawater osmotic pressure, forcing water molecules through membrane pores while rejecting dissolved salts and contaminants. This process generates potable water meeting World Health Organization drinking water standards from seawater containing 35,000-45,000 mg/L total dissolved solids (TDS), reducing salinity to below 500 mg/L TDS with rejection rates exceeding 99%.
The economic landscape of SWRO desalination has transformed dramatically, with capital costs demonstrating consistent declining trends following established learning curves. Analysis reveals 15% CAPEX reduction for every doubling of cumulative global capacity, driven by technological innovations in membrane chemistry, energy recovery devices, and process optimization[1]. Current CAPEX ranges USD 1,000-2,500 per m³/day capacity (IDR 16.6-41.5 million) depending on plant scale, location, feedwater quality, and technology selection[6]. Megaplants exceeding 500,000 m³/day capacity achieve unit costs 25-40% lower than small installations through economies of scale.
Operating expenditures average USD 0.39-0.66 per m³ (IDR 6,474-10,956) for medium-scale facilities, with energy consumption representing dominant cost component at 40-60% of total OPEX[7]. Technological innovations driving performance improvements include Thin-Film Nanocomposite (TFN) membranes incorporating nanomaterials enhancing permeability while maintaining selectivity, achieving industry-leading 99.89% salt rejection[5]. Artificial intelligence integration enables predictive maintenance reducing downtime 25% through real-time monitoring and automated optimization[9].
Energy recovery devices including pressure exchangers recover 95-98% of reject stream hydraulic energy, reducing specific energy consumption to 3-4 kWh/m³[8]. Hybrid configurations integrating Pressure Retarded Osmosis (PRO) demonstrate energy savings up to 20% in pilot installations[4]. This article examines SWRO technology from technical performance, economic viability, and implementation perspectives, providing engineering professionals, project developers, and decision-makers comprehensive analysis supporting technology evaluation and deployment strategies.
SWRO Technology Fundamentals and Process Description
Reverse osmosis represents membrane separation process utilizing hydraulic pressure overcoming natural osmotic pressure gradient, forcing water molecules from high-concentration solution (seawater) through semi-permeable membrane to low-concentration permeate side. Seawater osmotic pressure approximately 2.7 MPa (27 bar) for 35,000 mg/L TDS, requiring applied pressure 5.5-8.0 MPa (55-80 bar) achieving practical flux rates 10-20 L/m²/hr (LMH). Membrane selectivity rejects 99.0-99.8% dissolved salts while permitting water molecule passage, producing permeate with TDS 150-500 mg/L suitable for potable water applications or industrial processes requiring high-purity water.
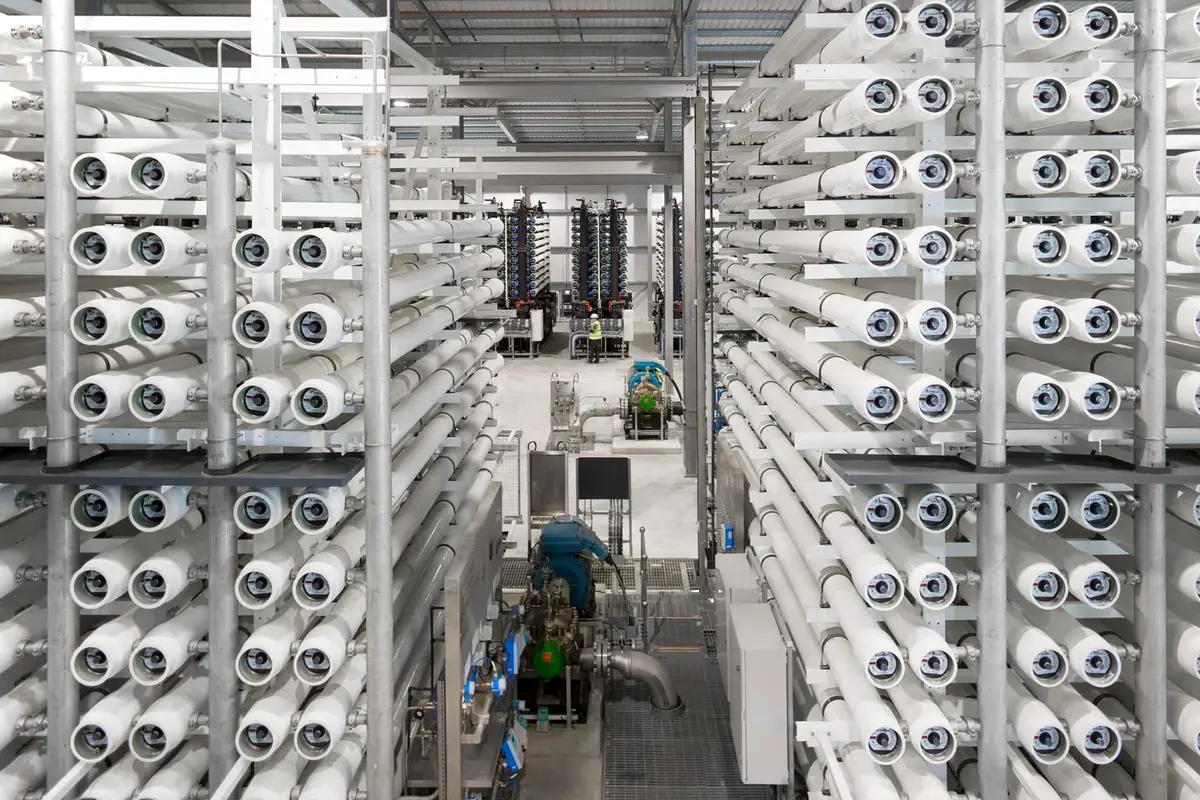
SWRO systems comprise several integrated unit operations functioning synergistically. Intake systems capture seawater through open ocean intakes or beach wells, with intake selection impacting pretreatment requirements and environmental considerations. Pretreatment processes remove suspended solids, organic matter, and biological fouling precursors preventing membrane degradation. Conventional pretreatment employs coagulation, flocculation, sedimentation, and dual-media filtration achieving turbidity below 1 NTU and Silt Density Index (SDI) below 3.
High-pressure pumps elevate pretreated seawater to operating pressure 5.5-8.0 MPa, consuming majority of process energy. Energy recovery devices (ERDs) including pressure exchangers (isobaric chambers) and Pelton turbines recover 95-98% hydraulic energy from concentrate stream at 5.2-7.5 MPa, reducing net specific energy consumption to 3-4 kWh/m³ for modern installations[8]. Membrane arrays configured in stages with interstage pumping optimize recovery and minimize concentrate disposal volumes. Post-treatment adjusts permeate chemistry through pH adjustment, remineralization, and disinfection producing finished water meeting regulatory standards.
SWRO System Technical Specifications and Performance Parameters:
Operating Conditions:
• Feed pressure: 5.5-8.0 MPa (55-80 bar / 800-1,160 psi)
• Membrane flux: 10-20 L/m²/hr (LMH) average
• Recovery ratio: 40-50% (seawater applications)
• Concentrate TDS: 60,000-75,000 mg/L
• Permeate TDS: 150-500 mg/L (target <500 mg/L)
• Salt rejection: 99.0-99.8% depending on membrane type
• Operating temperature: 15-30°C optimal range
Energy Consumption Profile:
• Specific energy consumption (SEC): 3.0-4.0 kWh/m³ modern plants[8]
• Without energy recovery: 6-8 kWh/m³
• High-pressure pumps: 55-65% total energy
• Pretreatment systems: 10-15% total energy
• Post-treatment: 5-10% total energy
• Auxiliary systems: 10-15% total energy
• Energy recovery efficiency: 95-98% (pressure exchangers)
Membrane Performance:
• Active membrane area: 37-41 m² per 8-inch element
• Element dimensions: 1016 mm length x 201 mm diameter
• Membrane material: Thin-Film Composite (TFC) polyamide
• Membrane lifespan: 3-5 years (TFC) vs. 2 years (cellulose acetate)[3]
• Permeability: 1.5-2.5 L/m²/hr/bar
• Maximum operating pressure: 8.3 MPa (83 bar)
System Configuration:
• Array arrangement: 2-stage (typical) or 3-stage (high recovery)
• Elements per pressure vessel: 6-8 elements
• Pressure vessels per rack: 40-200 depending on capacity
• Control systems: PLC/SCADA with remote monitoring
• Cleaning frequency: 2-4 times per year (chemical CIP)
• Membrane replacement: phased over 3-5 year cycle
• Plant capacity: 1,000-600,000 m³/day commercial range
Membrane chemistry fundamentally determines SWRO performance and economics. Thin-Film Composite (TFC) membranes featuring ultra-thin polyamide active layer (100-200 nanometers) on polysulfone support dominate commercial applications. Advanced Thin-Film Nanocomposite (TFN) membranes incorporate nanomaterials including zeolites, carbon nanotubes, or aquaporin proteins within polyamide matrix, enhancing water permeability 15-30% while maintaining salt rejection above 99.8%[5]. These innovations reduce operating pressure requirements lowering energy consumption and extending membrane lifespan.
Capital Cost Analysis and Investment Economics
SWRO plant capital expenditure (CAPEX) exhibits strong economies of scale and declining cost trends driven by technological learning curves. Comprehensive analysis reveals typical CAPEX ranges USD 1,000-2,500 per m³/day capacity (IDR 16.6-41.5 million) for seawater reverse osmosis plants, with significant variation depending on plant scale, geographic location, feedwater quality, and technology selection[6]. Economies of scale manifest prominently: large plants exceeding 100,000 m³/day achieve unit costs 25-40% lower than small facilities below 10,000 m³/day.
Capital cost components distribute across multiple categories with varying proportions depending on project specifics[10]. Membrane systems including pressure vessels, elements, and mounting racks represent 15-25% of total CAPEX. High-pressure pumps and energy recovery devices account for 20-30% of equipment costs. Pretreatment systems range 15-25% depending on feedwater quality and technology selection. Civil works including intake structures, buildings, and tanks comprise 20-30% of total costs. Electrical systems, instrumentation, and control represent 10-15%.
Learning curve analysis demonstrates consistent CAPEX reduction trends. Research documents 15% cost decrease for every doubling of cumulative global SWRO capacity, evidencing strong learning effects from manufacturing improvements, design optimization, and construction experience accumulation[1]. This learning rate implies SWRO technology maturation continues driving costs downward as installed capacity expands globally. Extrapolating historical trends suggests continued cost reductions through 2030s as cumulative capacity grows from current approximately 100 million m³/day to projected 150-200 million m³/day.
SWRO Plant Capital Cost Breakdown by Capacity Scale:
Small Scale (1,000-10,000 m³/day):
• Unit CAPEX: USD 2,000-2,500/m³/day (IDR 33.2-41.5 million)[6]
• Total project cost 5,000 m³/day: USD 10-12.5 million (IDR 166-207.5 billion)
• Membrane systems: 25% of equipment costs
• Pumps & ERDs: 25% of equipment costs
• Civil works: 25-30% (higher proportion small plants)
• Applications: remote islands, resorts, small municipalities
Medium Scale (10,000-100,000 m³/day):
• Unit CAPEX: USD 1,200-1,800/m³/day (IDR 19.9-29.9 million)
• Total project cost 50,000 m³/day: USD 60-90 million (IDR 996-1,494 billion)
• Membrane systems: 20% of equipment costs
• Pumps & ERDs: 28% of equipment costs
• Civil works: 22-28% lower proportion than small
• Applications: medium cities, industrial complexes, mine sites
Large Scale (100,000-500,000 m³/day):
• Unit CAPEX: USD 1,000-1,400/m³/day (IDR 16.6-23.2 million)
• Total project cost 200,000 m³/day: USD 200-280 million (IDR 3.32-4.65 trillion)
• Membrane systems: 18% of equipment costs
• Pumps & ERDs: 30% of equipment costs
• Civil works: 20-25% economies of scale
• Applications: major cities, metropolitan water supply
Megaplant Scale (>500,000 m³/day):
• Unit CAPEX: USD 800-1,200/m³/day (IDR 13.3-19.9 million)
• Total project cost 600,000 m³/day: USD 480-720 million (IDR 7.97-11.95 trillion)
• Membrane systems: 16-18% optimized procurement
• Pumps & ERDs: 32% larger equipment efficiency
• Civil works: 18-22% maximum economies
• Applications: mega-cities, regional water authorities
• Examples: Sorek Israel 624,000 m³/d, Carlsbad USA 190,000 m³/d
Real-world case studies illustrate cost variations and determining factors. The Carlsbad Desalination Plant in California (190,000 m³/day capacity) required initial investment exceeding USD 1 billion representing approximately USD 5,263 per m³/day, substantially above typical ranges due to stringent California environmental regulations, renewable energy requirements, and extensive permitting processes[2]. Conversely, the Sorek Plant in Israel achieved approximately USD 500 million total cost representing USD 801 per m³/day, demonstrating megaproject economies of scale and streamlined regulatory environment.
Operating Cost Structure and Lifecycle Economics
Operating expenditure (OPEX) represents recurring costs determining long-term economic viability and water tariff requirements for SWRO facilities. Comprehensive analysis reveals operating costs range USD 0.39-0.66 per m³ (IDR 6,474-10,956) for medium-scale brackish water and seawater plants, with seawater applications trending toward upper range due to higher energy requirements[7]. Energy consumption dominates OPEX structure at 40-60% of total operating costs, emphasizing critical importance of energy efficiency improvements and favorable electricity pricing for project economics.
Energy consumption determining OPEX magnitude depends on multiple factors including feedwater salinity, recovery ratio, membrane efficiency, energy recovery device performance, and auxiliary system design. Modern SWRO plants achieve specific energy consumption (SEC) 3.0-4.0 kWh/m³ for seawater applications, representing dramatic improvement from early installations consuming 6-8 kWh/m³ without energy recovery[8]. Energy recovery devices (ERDs) prove critical enabling this performance: pressure exchangers recover 95-98% of concentrate stream hydraulic energy, reducing net energy consumption from 6-7 kWh/m³ to 3-4 kWh/m³.
Membrane replacement constitutes significant recurring cost requiring strategic management. Seawater RO membrane replacement accounts for up to 5% of total cost of water and 12% of operating costs according to major membrane manufacturers[3]. Advanced TFC polyamide membranes demonstrate lifespan 3-5 years versus cellulose acetate membranes lasting maximum 2 years, yielding substantial lifecycle cost savings despite higher initial membrane prices. Membrane costs range USD 800-1,200 per element for standard 8-inch SWRO elements.
Detailed OPEX Analysis: 50,000 m³/day SWRO Facility
Energy Costs (48% of Total OPEX):
• Annual energy consumption: 57.4 million kWh
• Annual energy cost: USD 5.74 million (IDR 95.3 billion)
• Unit energy cost: USD 0.35/m³ (IDR 5,810/m³)[2]
• High-pressure pumps: USD 3.2 million (56% of energy)
• Pretreatment systems: USD 0.86 million (15% of energy)
• Post-treatment: USD 0.57 million (10% of energy)
• Auxiliary systems: USD 1.09 million (19% of energy)
Membrane and Consumables (22% of Total OPEX):
• Total membranes in service: 2,400 elements
• Annual replacement (25%): 600 elements/year
• Membrane cost: USD 1,000/element average
• Annual membrane cost: USD 0.60 million (IDR 9.96 billion)[3]
• Cartridge filters: USD 0.36 million annually
• Cleaning chemicals (CIP): USD 0.24 million annually
• Pretreatment chemicals: USD 0.48 million annually
• Post-treatment chemicals: USD 0.36 million annually
• Subtotal consumables: USD 2.64 million (IDR 43.8 billion)
Labor and Maintenance (20% of Total OPEX):
• Operators (15 FTE): USD 0.90 million (IDR 14.94 billion)
• Maintenance technicians (6 FTE): USD 0.42 million (IDR 6.97 billion)
• Management and admin (4 FTE): USD 0.30 million (IDR 4.98 billion)
• Total labor: USD 1.62 million annually
• Spare parts inventory: USD 0.24 million
• Preventive maintenance: USD 0.18 million
• Equipment repairs: USD 0.30 million
• Subtotal labor/maintenance: USD 2.34 million (IDR 38.84 billion)
Total Annual OPEX and Unit Costs:
• Total annual OPEX: USD 11.92 million (IDR 197.87 billion)[10]
• Unit production cost: USD 0.73/m³ (IDR 12,118/m³)
• Energy component: USD 0.35/m³ (48%)
• Consumables component: USD 0.16/m³ (22%)
• Labor/maintenance component: USD 0.14/m³ (20%)
• Other costs component: USD 0.07/m³ (10%)
• Levelized cost of water (including CAPEX recovery): USD 1.10-1.40/m³
Lifecycle cost analysis incorporating both CAPEX and OPEX over 25-30 year facility lifespans determines true economic viability and water tariff requirements. Levelized Cost of Water (LCOW) methodology discounts all capital and operating costs to present value basis, dividing by total discounted water production volume. Typical LCOW for modern SWRO facilities ranges USD 0.60-1.50 per m³ (IDR 9,960-24,900) depending on scale, energy costs, financing terms, and local conditions[7].
Latest Membrane Technology Innovations and Performance Enhancement
Membrane technology represents the heart of SWRO systems, with continuous innovations driving performance improvements and cost reductions. Thin-Film Nanocomposite (TFN) membranes incorporating nanomaterials represent current state-of-art, achieving industry-leading 99.89% salt rejection while enhancing water permeability 15-30% compared to conventional TFC membranes[5]. LG Water Solutions' TFN technology integrates zeolite nanoparticles within polyamide matrix, creating additional water transport pathways while maintaining selectivity.
Fouling-resistant membrane chemistries address primary operational challenge reducing flux and requiring frequent cleaning. Surface modification techniques including hydrophilic coating, zwitterionic grafting, or antimicrobial nanoparticle incorporation reduce organic and biological fouling propensity. DuPont FilmTec™ SW30XFR membranes specifically engineered for fouling resistance demonstrate stable salt rejection despite repeated chemical cleaning cycles[3]. Reduced fouling translates directly to lower chemical costs, decreased cleaning-related downtime, and extended membrane lifespan producing substantial operational savings.
Membrane Technology Evolution and Performance Comparison:
Second Generation - Thin-Film Composite (TFC) Polyamide:
• Commercial introduction: 1980s-present
• Salt rejection: 99.0-99.7% standard models
• Operating pressure: 5.5-7.5 MPa
• Membrane lifespan: 3-5 years[3]
• Permeability: 1.5-2.0 L/m²/hr/bar
• Status: dominant technology for current installations
Third Generation - Thin-Film Nanocomposite (TFN):
• Commercial introduction: 2010s-present
• Salt rejection: 99.7-99.89% (industry leading)[5]
• Operating pressure: 5.0-7.0 MPa (reduced vs. TFC)
• Membrane lifespan: 4-6 years (extended)
• Permeability: 2.0-2.6 L/m²/hr/bar (30% improvement)
• Nanomaterials: zeolites, silica, metal-organic frameworks
• Status: premium technology for high-performance applications
Emerging Technologies (Pilot/Development Stage):
• Carbon nanotube (CNT) membranes: 100x permeability increase potential
• Graphene oxide membranes: ultimate thinness sub-nanometer selectivity
• Aquaporin biomimetic membranes: nature-inspired water channels
• Mixed-matrix membranes: hybrid organic-inorganic materials
• Status: laboratory-scale or small pilot demonstrations
• Commercialization timeline: 2025-2035 depending on technology
Artificial intelligence and machine learning integration represents transformative development optimizing SWRO operations and reducing costs. AI-powered monitoring systems analyze real-time data from thousands of sensors throughout pretreatment, membrane arrays, and post-treatment, detecting anomalies predicting equipment failures before occurrence. Predictive maintenance reduces unplanned downtime by 25% according to industry implementations[9], avoiding costly emergency repairs and production losses.
Hybrid and integrated systems combining multiple technologies achieve synergistic performance improvements. Pressure Retarded Osmosis (PRO) integration with conventional SWRO utilizes concentrate stream salinity gradient generating additional hydraulic pressure, reducing net energy consumption up to 20% in pilot demonstrations[4]. Two-year pilot studies of SWRO-PRO hybrid systems (240 m³/day capacity) using seawater as draw solution demonstrated nearly 20% energy reduction, though scaling challenges remain for commercial implementation.
Implementation Challenges and Risk Mitigation Strategies
Environmental considerations represent significant challenges for SWRO project development, requiring comprehensive assessment and mitigation. Intake systems whether open ocean or subsurface impact marine ecosystems through impingement and entrainment of marine organisms. Concentrate discharge containing 60,000-75,000 mg/L TDS at approximately twice intake flow rate requires proper dispersion preventing localized hypersalinity impacting benthic communities.
Energy intensity and carbon footprint concerns drive renewable energy integration and efficiency improvements. SWRO energy consumption 3-4 kWh/m³ translates to carbon emissions 1.5-3.0 kg CO₂/m³ depending on electricity grid carbon intensity. Transitioning to renewable energy sources reduces emissions 90-95%, with solar-powered RO systems producing 0.1-0.3 kg CO₂/m³[9]. Hybrid renewable-grid systems utilizing solar/wind when available and grid power during low renewable production optimize costs while substantially reducing carbon footprint.
Future Trends and Market Outlook
Global desalination capacity expansion continues accelerating, driven by water scarcity intensification, population growth, economic development, and climate change impacts. Cost reduction trajectories continue following established learning curves with additional innovation-driven improvements. Extrapolating historical 15% cost reduction per capacity doubling suggests SWRO CAPEX declining to USD 800-2,000 per m³/day by 2030-2035 depending on plant scale[1].
Renewable energy integration accelerates driven by declining solar and wind costs combined with carbon emission reduction mandates. Solar-powered desalination systems achieve economic viability in high-insolation regions as photovoltaic costs decline. Wind-powered systems prove competitive in favorable wind regimes[8]. Hybrid solar-wind-battery systems provide 24/7 renewable operation at levelized energy costs competitive with grid electricity in many locations.
Conclusions and Strategic Recommendations
Seawater Reverse Osmosis desalination represents mature, proven technology delivering cost-effective freshwater production for water-stressed regions globally. Current capital costs USD 1,000-2,500 per m³/day capacity (IDR 16.6-41.5 million) and operating costs USD 0.39-0.66 per m³ (IDR 6,474-10,956) position SWRO competitively against alternative water sources[2].
Organizations evaluating SWRO implementation should prioritize comprehensive feasibility studies addressing technical, economic, environmental, and institutional dimensions. Technology selection requires balancing performance, reliability, lifecycle costs, and local conditions. Strategic recommendations include early engagement with experienced technology providers, phased development approaches, long-term energy procurement strategies, and comprehensive operator training programs.
Frequently Asked Questions: SWRO Desalination Technology
1. What are current SWRO plant capital costs?
SWRO plant CAPEX ranges USD 1,000-2,500 per m³/day capacity (IDR 16.6-41.5 million). Small plants cost USD 2,000-2,500/m³/day, medium plants USD 1,200-1,800/m³/day, and megaplants USD 800-1,200/m³/day[6].
2. What are typical SWRO operating costs?
Operating costs range USD 0.39-0.66 per m³ (IDR 6,474-10,956) with energy at 40-60% of OPEX[7]. Energy consumption is 3-4 kWh/m³. Membrane replacement accounts for 12% of operating costs[3].
3. How long do SWRO membranes last?
Modern TFC polyamide membranes last 3-5 years, while advanced TFN membranes extend to 4-6 years[5]. Elements cost USD 800-1,200 each.
4. What energy recovery devices are used?
Pressure exchangers recover 95-98% of concentrate hydraulic energy, reducing consumption from 6-8 kWh/m³ to 3-4 kWh/m³[8].
5. What are latest membrane innovations?
TFN membranes achieve 99.89% salt rejection with 15-30% permeability improvement[5]. AI integration reduces downtime 25%[9].
6. How does PRO-SWRO hybrid work?
PRO integration reduces energy consumption up to 20% by utilizing concentrate salinity gradient[4].
7. How does renewable energy impact costs?
Solar/wind integration reduces carbon footprint 90-95% from 1.5-3.0 to 0.1-0.3 kg CO₂/m³[9].
8. What are future cost projections?
CAPEX projected to decline to USD 800-2,000/m³/day by 2030-2035 following 15% reduction per capacity doubling[1].
References and Technical Resources
1. Caldera, U., Bogdanov, D., & Breyer, C. (2017). Learning Curve for Seawater Reverse Osmosis Desalination Plants. Water Resources Research.
https://agupubs.onlinelibrary.wiley.com/doi/pdf/10.1002/2017WR021402
2. Genesis Water Technologies. (2024). Seawater RO Operating Costs Analysis.
https://genesiswatertech.com/blog-post/seawater-ro-operating-costs-analysis/
3. DuPont Water Solutions. (2024). Desalination with SWRO Membranes.
https://www.dupont.com/water/industries/desalination-seawater-reverse-osmosis-membranes.html
4. Ahmed, A., et al. (2024). PRO-SWRO Hybrid Case Study. Frontiers in Energy Research.
https://www.frontiersin.org/journals/energy-research/articles/10.3389/fenrg.2024.1448402/full
5. LG Water Solutions. (2024). Desalination Applications.
https://www.lgwatersolutions.com/applications/desalination/
6. Desalter. (2024). Cost of Desalination Plant Construction. Medium.
https://medium.com/@desalter/plant-prices-the-costs-of-constructing-a-desalination-facility-2c31f7fcb690
7. Dehghan Monfared, M.A., et al. (2021). Economics of BWRO Desalination. PMC.
https://pmc.ncbi.nlm.nih.gov/articles/PMC8399043/
8. Al-Washali, T., et al. (2025). Renewable Energy in SWRO. IJIRSS.
https://ijirss.com/index.php/ijirss/article/download/9924/2255/17020
9. Rotec HID. (2025). Emerging RO Technologies 2025.
https://www.rotec-hid.com/id/blog/emerging-technologies-for-best-ro-water-system-2025/
10. ResearchGate. (2020). CAPEX and OPEX of SWRO Plant.
https://www.researchgate.net/figure/Total-capital-expenditure-CAPEX-and-total-annual-operational-expenditure-OPEX-of-a_tbl1_337835890

SWRO Desalination Plant Engineering and Project Development Services
SUPRA International provides comprehensive engineering consulting and turnkey project delivery for Seawater Reverse Osmosis (SWRO) desalination facilities across Indonesia and Southeast Asia. Our expertise encompasses feasibility studies and techno-economic analysis, membrane technology selection and system optimization, intake and discharge system design, energy recovery and renewable integration, environmental impact assessment and permitting, and complete EPC/DBO delivery models for industrial facilities, municipalities, resorts, mining operations, and offshore platforms requiring reliable freshwater supply.
Discuss your SWRO desalination for water supply needs now
Contact SUPRA International to discuss site assessment, technology evaluation, cost estimation, environmental compliance, financing strategies, and full-cycle project implementation from concept through commissioning and operations support
Share:
If you face challenges in water, waste, or energy, whether it is system reliability, regulatory compliance, efficiency, or cost control, SUPRA is here to support you. When you connect with us, our experts will have a detailed discussion to understand your specific needs and determine which phase of the full-lifecycle delivery model fits your project best.