Challenges in Mine Water Management and Their Effects on Operational Sustainability
Mine Water Management Challenges: Technical Analysis of Acid Mine Drainage, Dewatering Impacts, Water Balance Optimization, Treatment Technologies, Regulatory Compliance, and Sustainable Closure Planning for Mining Operations
Reading time: 75 minutes
Key Highlights
• Critical Mine Water Challenge Spectrum: Mining operations face approximately 12-18 distinct recurring water management problems affecting operational continuity, environmental compliance, community relations, and financial performance, with acid mine drainage representing 35-45% of long-term environmental liabilities, dewatering challenges consuming 15-30% of operational energy costs, water treatment systems requiring capital investment USD 5-50 million depending on scale and chemistry complexity, and post-closure water quality degradation creating perpetual treatment obligations spanning decades to centuries at annual costs reaching USD 500,000-15,000,000 for major operations
• Acid Mine Drainage Severity and Prevalence: Sulfide mineral oxidation affects approximately 40-60% of global metal mining operations and 70-90% of coal mines in sulfide-bearing formations, generating acidity (pH 2.0-4.5), dissolved metals (iron 50-5,000 mg/L, aluminum 20-500 mg/L, copper 5-200 mg/L, zinc 10-800 mg/L), and sulfate concentrations (500-20,000 mg/L) exceeding discharge standards by factors of 10-1,000, requiring treatment in perpetuity with present value liability often exceeding USD 20-200 million for medium to large operations despite advanced prediction, prevention, and mitigation strategies
• Dewatering and Water Balance Complexity: Open pit and underground mining operations require continuous groundwater removal averaging 500-50,000 m³/day depending on hydrogeological conditions, creating operational challenges including aquifer sustainability assessment (distinguishing renewable recharge from fossil groundwater mining), regional water table impacts affecting surrounding users within 2-20 km radius, discharge management for excess water during wet seasons versus shortages during dry periods, and pit lake formation planning where post-closure water quality and quantity determine land use options affecting site value and perpetual care obligations
• Integrated Management Imperative: Successful mine water management requires holistic integration of predictive geochemical characterization (static and kinetic testing identifying acid generation potential), hydrogeological investigation (aquifer properties, recharge mechanisms, connectivity), engineering design (collection systems, treatment infrastructure, monitoring networks), operational optimization (water balance modeling, treatment performance, adaptive management), regulatory compliance (discharge permits, monitoring requirements, stakeholder engagement), and closure planning (passive treatment sustainability, financial assurance, perpetual care arrangements) collectively determining whether water management represents manageable operational cost or catastrophic environmental and financial liability
Executive Summary
Mine water management represents one of mining industry's most persistent and consequential technical challenges, fundamentally affecting operational feasibility, environmental performance, regulatory compliance, community acceptance, and long-term financial liability across all mining sectors including coal, metallic ores, industrial minerals, and aggregate operations. Unlike many engineering challenges where problems can be permanently solved through capital investment and technical innovation, mine water issues often persist throughout operational life and extend indefinitely into post-closure period, creating obligations spanning generations and requiring perpetual management attention, financial resources, and technical oversight long after mineral extraction ceases and revenue generation ends.
The fundamental nature of mine water challenges stems from mining's disruption of natural hydrological and geochemical equilibria established over geological timescales, with excavation exposing previously buried minerals to oxidizing atmospheric conditions, groundwater removal altering regional aquifer systems and flow patterns, and waste rock and tailings storage creating new landforms with distinct geochemical and hydraulic characteristics requiring management. Sulfide mineral oxidation generates acid mine drainage through well-understood but difficult-to-prevent reactions where pyrite (FeS₂) and other sulfide minerals react with oxygen and water producing sulfuric acid and dissolving metals from surrounding rock, creating contaminated water requiring treatment before discharge to prevent aquatic ecosystem damage, drinking water degradation, and agricultural productivity losses affecting downstream communities and ecosystems for decades to centuries after mining disturbance.
Indonesian mining sector faces particular mine water management challenges driven by tropical climate with high rainfall (2,000-4,000 mm/year in many mining regions) creating substantial water balance management requirements, volcanic and sedimentary geology hosting both valuable mineral deposits and reactive sulfide minerals prone to acid generation, rapid regulatory evolution with increasingly stringent discharge standards and monitoring requirements, community sensitivity to water resource impacts affecting agriculture and domestic supply, and economic pressures requiring cost-effective solutions balancing environmental protection with operational viability. The archipelago's mining operations spanning coal in Kalimantan and Sumatra, nickel in Sulawesi, copper-gold in Papua, tin in Bangka-Belitung, and bauxite across multiple islands collectively face diverse water management challenges requiring site-specific technical solutions adapted to local geology, hydrology, climate, and regulatory frameworks while drawing on global best practices and proven technologies.
This comprehensive technical analysis provides systematic examination of mine water management problems, organized across seven major challenge categories: acid mine drainage including prediction, prevention, and treatment; pit dewatering and regional groundwater impacts affecting aquifer sustainability and surrounding users; water balance optimization managing seasonal variability and drought resilience; tailings and waste rock management addressing seepage control and geochemical stability; water treatment system design, operation, and optimization for various contaminants and flow regimes; regulatory compliance and monitoring encompassing discharge standards, reporting requirements, and stakeholder engagement; and mine closure and post-closure water management ensuring long-term environmental protection and financial sustainability. Each problem category receives detailed treatment covering characteristic symptoms enabling problem identification, underlying technical causes based on hydrogeology and geochemistry, diagnostic procedures including testing and monitoring, immediate management responses stabilizing conditions, long-term solutions preventing recurrence, cost-benefit analysis quantifying investment requirements and returns, and case studies illustrating successful problem resolution at operating facilities demonstrating real-world application of technical principles.
Problem Category 1: Acid Mine Drainage - Formation, Prediction, and Characterization
Acid mine drainage (AMD) constitutes mining's most significant and persistent water quality challenge, affecting thousands of mine sites globally with legacy contamination from historical operations continuing decades to centuries after closure, while modern operations invest substantial resources in prediction, prevention, and mitigation strategies attempting to avoid repeating past environmental catastrophes. The fundamental chemistry involves sulfide mineral oxidation, primarily pyrite (FeS₂) though also pyrrhotite, chalcopyrite, arsenopyrite, and other sulfide species, reacting with oxygen and water through complex reaction pathways producing sulfuric acid, dissolved ferrous iron which subsequently oxidizes to ferric iron, and elevated concentrations of metals and metalloids leached from surrounding rock matrix under acidic conditions.
The overall pyrite oxidation reaction proceeds: 4FeS₂ + 15O₂ + 14H₂O → 4Fe(OH)₃ + 8H₂SO₄, showing production of eight moles of sulfuric acid per four moles of pyrite oxidized, with reaction rate controlled by multiple factors including oxygen availability (reaction proceeds only under aerobic conditions), water availability (completely dry materials oxidize slowly though produce acidity when rewetted), temperature (rates approximately double for each 10°C increase), bacterial catalysis (iron-oxidizing bacteria including Acidithiobacillus ferrooxidans accelerate reactions by factors of 10⁵-10⁶), particle size (smaller particles with greater surface area react faster), and pH (acidic conditions enhance iron oxidation cycling accelerating overall process). This complexity creates situations where identical mineralogy produces vastly different drainage quality depending on physical configuration, moisture regime, and microbial community establishment, requiring careful site-specific characterization rather than simple mineral composition assessment.
Figure 1: Acid Mine Drainage Formation Decision Tree and Prevention Strategy Selection
Initial Geochemical Characterization Phase
Conduct comprehensive mineralogical and geochemical testing
on waste rock, tailings, and wall rock materials
establishing acid generation and neutralization potential
↓
Step 1: Static Testing - Acid-Base Accounting
Acid-Base Accounting (ABA) Analysis
→ Maximum Potential Acidity (MPA): Total sulfur content × 31.25 = kg CaCO₃ equivalent acidity per tonne
(Assumes all sulfur as pyrite; conservative estimate)
→ Neutralization Potential (NP): Carbonate content via acid digestion and back-titration = kg CaCO₃ equivalent per tonne
(Measures reactive carbonates: calcite, dolomite, siderite, ankerite)
→ Net Neutralization Potential (NNP): NNP = NP - MPA
• NNP > +20 kg CaCO₃/t → Likely non-acid forming (NAF)
• NNP -20 to +20 kg CaCO₃/t → Uncertain behavior, requires kinetic testing
• NNP < -20 kg CaCO₃/t → Potentially acid forming (PAF)
→ NP/MPA Ratio: Additional classification criterion
• Ratio > 3:1 → Non-acid forming
• Ratio 1:1 to 3:1 → Uncertain, kinetic testing required
• Ratio < 1:1 → Acid forming likely
↓
Classification Decision Point
| ABA Classification | Material Characteristics | Next Step Required | Management Pathway |
|---|---|---|---|
| Non-Acid Forming (NAF) NNP > +20, Ratio > 3 |
Low sulfide, high carbonate content, excess neutralization capacity, minimal acid risk | Confirmation kinetic testing on representative samples (3-6 month humidity cells) | Use in construction (haul roads, embankments), co-disposal with PAF as neutralizing agent, minimal environmental risk |
| Uncertain NNP -20 to +20 |
Balanced sulfide and carbonate, behavior depends on reaction kinetics, moisture, oxygen | MANDATORY kinetic testing (humidity cells 20-52 weeks minimum, field trials if possible) | Await kinetic results; interim treat as PAF using conservative approach until confirmed NAF |
| Potentially Acid Forming (PAF) NNP < -20, Ratio < 1 |
High sulfide, low carbonate, insufficient neutralization, acid generation expected | Kinetic testing to determine lag time before acid onset, reaction rates, peak acidity loads | Proceed to prevention strategy selection (oxygen exclusion, water covers, encapsulation, neutralization) |
↓
Step 2: Kinetic Testing (for PAF and Uncertain materials)
Kinetic Test Methodologies and Interpretation
Humidity cell testing (ASTM D5744):
→ 1 kg sample in column, weekly cycles: 3 days dry air exposure (oxidation), 3 days moist air (reaction), 1 day leach with deionized water
→ Monitor leachate pH, conductivity, acidity, sulfate, metals weekly for minimum 20 weeks (ideally 52+ weeks until steady state)
→ Interpretation: Declining pH below 5.0-5.5 with rising sulfate, acidity, metals indicates acid generation onset
→ Lag time (weeks until pH decline) estimates field lag time (years) via acceleration factor ~10-100×
→ Peak acid/sulfate flux indicates maximum treatment load; total cumulative release estimates long-term liability
Column leach testing (field-scale):
→ 1-10 tonne samples in outdoor columns, natural rainfall and weathering, multi-year monitoring
→ More realistic but slower; better represents field moisture, temperature, bacterial colonization
→ Provides validation of accelerated laboratory results
Field test pads:
→ 1,000-100,000 tonne test piles monitored for 2-10 years
→ Most realistic but expensive and time-consuming; reserved for very large projects or novel geochemical settings
→ Recommended for projects with >100 million tonne PAF waste requiring long-term storage
↓
Step 3: Prevention Strategy Selection Based on Results
| Prevention Strategy | Technical Approach | Applicability | Effectiveness & Cost |
|---|---|---|---|
| Source Segregation | Separate PAF from NAF materials during mining, minimize PAF exposure, blend NAF with PAF for in-situ neutralization | Best for heterogeneous deposits with distinct NAF and PAF zones, requires grade control capabilities | Effectiveness: High if properly executed Cost: Low (mainly operational discipline), USD 0.10-0.50/t incremental |
| Dry Cover / Oxygen Barrier | Compacted low-permeability clay or synthetic cover limiting oxygen ingress to <5-10% atmospheric, reducing oxidation rate 80-95% | Arid/semi-arid climates, above water table storage, requires ongoing maintenance | Effectiveness: 80-95% reduction Cost: USD 5-25/m² cover area (USD 2-10/t waste depending on lift thickness) |
| Water Cover (subaqueous) | Permanent flooding (pit lakes, tailings ponds) excluding oxygen via diffusion limitation through water column >3-5 m depth | Below-grade storage, adequate water supply, acceptable for perpetual flooding, thermal stratification beneficial | Effectiveness: 95-99+% reduction if >5 m depth maintained Cost: Variable, depends on water availability and evaporation |
| Chemical Additives | Alkaline amendments (limestone, lime) mixed with PAF, bactericides (surfactants, biocides) inhibiting microbial catalysis | Rapid construction, cannot implement covers, moderate PAF severity, limestone must be reactive (not dolomite) | Effectiveness: 50-85% reduction, temporary (alkalinity consumed over years-decades) Cost: USD 2-10/t depending on dose rate, transport |
| Encapsulation | PAF core surrounded by NAF layers providing neutralization and oxygen/water barrier | Sufficient NAF available (2-5:1 mass ratio), controlled placement possible, large waste facilities | Effectiveness: 70-90% reduction Cost: USD 0.20-2.00/t depending on haul distances and NAF availability |
Critical Decision Factors for Strategy Selection
→ Material quantity and acidity severity: Small volumes (<1 Mt) with moderate acidity → encapsulation or chemical treatment; Large volumes (>10 Mt) with high acidity → water cover or engineered dry cover essential
→ Climate and water balance: High rainfall (>1,500 mm/yr) → water covers challenging due to management volume, dry covers require robust design; Arid (<500 mm/yr) → dry covers effective, water covers require makeup water sourcing
→ Regulatory and closure objectives: Walk-away closure desired → passive covers (dry, water) preferred; Perpetual treatment acceptable → may accept some seepage with active treatment
→ Long-term performance assurance: Covers require maintenance (erosion repair, settlement management); Water quality monitoring perpetual; Financial assurance calculations must include present value of perpetual obligations
→ Combination approaches: Often most cost-effective combines multiple strategies: segregation + encapsulation + cover system providing defense-in-depth
Implementation Sequence: Early geochemical characterization during exploration/feasibility enables mine planning integration (pit sequencing, waste scheduling, infrastructure siting). Ongoing characterization during operations refines predictions and validates prevention performance. Kinetic testing continues through operations building closure design database. Prevention strategy implementation phases through mine life with final closure cover installation following waste placement completion. Monitoring continues perpetually confirming performance and triggering adaptive management if needed.
Table 1: Comprehensive Acid Mine Drainage Problem Matrix
| AMD Problem Type | Characteristic Symptoms | Root Causes | Diagnostic Approach | Management Solutions |
|---|---|---|---|---|
| Waste Rock Drainage pH 2.5-4.0 | Orange/red precipitates (schwertmannite, jarosite), pH <4.5, Fe 100-2,000 mg/L, SO₄ 1,000-10,000 mg/L, Cu, Zn, Al elevated | High sulfide content (>1-2% S), insufficient neutralization potential, oxygen/water ingress enabling oxidation, bacterial catalysis accelerating reaction | Review ABA testing (NNP negative?), humidity cell results (acid onset timing), waste rock composition (sulfide distribution), inspect dump for vegetation die-off, seepage discoloration | Prevention: Source segregation separating PAF/NAF, encapsulation with NAF, dry cover limiting O₂, water cover if geometry allows Treatment: Active lime neutralization, passive wetlands if low flow, financial assurance for perpetual treatment |
| Tailings AMD pH 3.0-5.0 | Acidic seepage from tailings facility perimeter, pH 3-5, sulfate 500-5,000 mg/L, dissolved metals site-specific (Cu, Zn, Ni, Co depending on ore) | Sulfide minerals in tailings (flotation often concentrates sulfides in tailings), fine particle size accelerating oxidation (high surface area), seepage pathway through dam or foundation | Pore water sampling (pH, chemistry), tailings solid-phase analysis (sulfide remaining after processing), seepage collection system monitoring, geophysical survey locating preferential pathways | Active operations: Subaqueous deposition maintaining water cover, lime addition to process stream, desulfurization (flotation) removing sulfides before tailings deposition Closure: Permanent water cover, dry cover with oxygen barrier, seepage collection and treatment |
| Pit Wall Seepage Acid pH 3.5-5.5 | Localized seeps from pit walls, yellow/orange staining, pH 3.5-5.5, elevated sulfate and metals, often associated with specific geological units (black shale, altered zones) | Groundwater flow through sulfide-bearing wall rock oxidized by pit excavation exposure, fracture flow concentrating discharge at seep points, seasonal variation with recharge patterns | Map seep locations vs geology, analyze seep chemistry identifying metal signature matching specific units, measure flow rates, install piezometers characterizing groundwater gradients driving seepage | Source control: Horizontal drains intercepting groundwater before wall contact, surface water diversion preventing infiltration, pit wall coating/sealing (expensive, often impractical) Collection/treatment: Seepage sumps at pit floor, treatment before discharge, incorporate into pit lake water balance planning |
| Underground Mine Water pH 2.0-4.0 | Extreme acidity pH 2-4, very high Fe (1,000-10,000+ mg/L), sulfate (5,000-50,000 mg/L), dissolved metals (hundreds to thousands mg/L), corrosion of pumps and pipes | Extensive exposure of sulfide mineralization in drifts/stopes, groundwater contact, elevated underground temperature accelerating kinetics (2× rate per 10°C increase), pyrite oxidation products (Fe³⁺) perpetuating reactions | Monitor dewatering discharge chemistry trends (progressive acidification?), assess ore/waste rock sulfide content, measure underground water temperature and DO, calculate acid generation rate from sulfate loading | Prevention difficult: Underground flooding after closure may limit oxidation if saturated, but acidity flush upon initial flooding Treatment required: Active lime/limestone neutralization, HDS (high-density sludge) systems, consideration of in-situ treatment (limestone drains in flooded workings), perpetual treatment planning |
| Delayed Acid Onset | Initially circumneutral pH 6-7 for months to years, then progressive decline to pH 4-5, increasing metals, timing unexpected based on ABA | Neutralizing mineral depletion (carbonates consumed by initial acidity), bacterial colonization lag (A. ferrooxidans takes months-years to establish), physical changes (cover failure increasing oxygen), sulfide zone exposure (pit deepening into more pyritic units) | Time-series water quality showing pH trend, review kinetic test predictions (was lag time underestimated?), inspect for operational changes (new waste source, cover damage), conduct updated geochemical characterization | Early detection critical: Implement trend monitoring (monthly pH, SO₄, specific metals), trigger adaptive management (pH <5.5 initiates enhanced neutralization) Mitigation: Alkaline amendment application if early stages, cover enhancement, transition to active treatment if advanced degradation |
| Neutral Mine Drainage with Metals | pH 6-8 (circumneutral), but elevated specific metals (Ni, Co, Mo, Se, As) exceeding standards despite lack of acidity, sulfate moderate | Sulfide oxidation releasing metals, but sufficient neutralization (carbonates) maintaining pH, specific minerals controlling release (arsenopyrite → As, pentlandite → Ni, molybdenite → Mo) | Detailed geochemical analysis (mineralogy, sequential leach testing identifying host phases), pH-Eh modeling predicting metal solubility, review discharge standards for site-specific metals | Different treatment approach: pH adjustment ineffective (already neutral), require specific metal removal (adsorption, ion exchange, membrane, precipitation as sulfides or hydroxides) Prevention: Source control if specific units identified, encapsulation or removal from waste stream |
AMD management costs vary dramatically: Prevention through source segregation and engineered covers USD 2-15/tonne waste material (capital intensive but lower long-term liability), active treatment USD 0.50-5.00/m³ treated water (perpetual operating cost), passive treatment USD 0.10-1.00/m³ (lower operating cost but larger land footprint, performance uncertainty). Total present value liability for medium operation (10 Mt PAF waste, 50 L/s seepage, perpetual treatment) ranges USD 20-80 million depending on chemistry severity and treatment approach selected, emphasizing economic imperative of prevention over treatment where technically feasible.
Problem Category 2: Mine Dewatering and Regional Groundwater Impacts
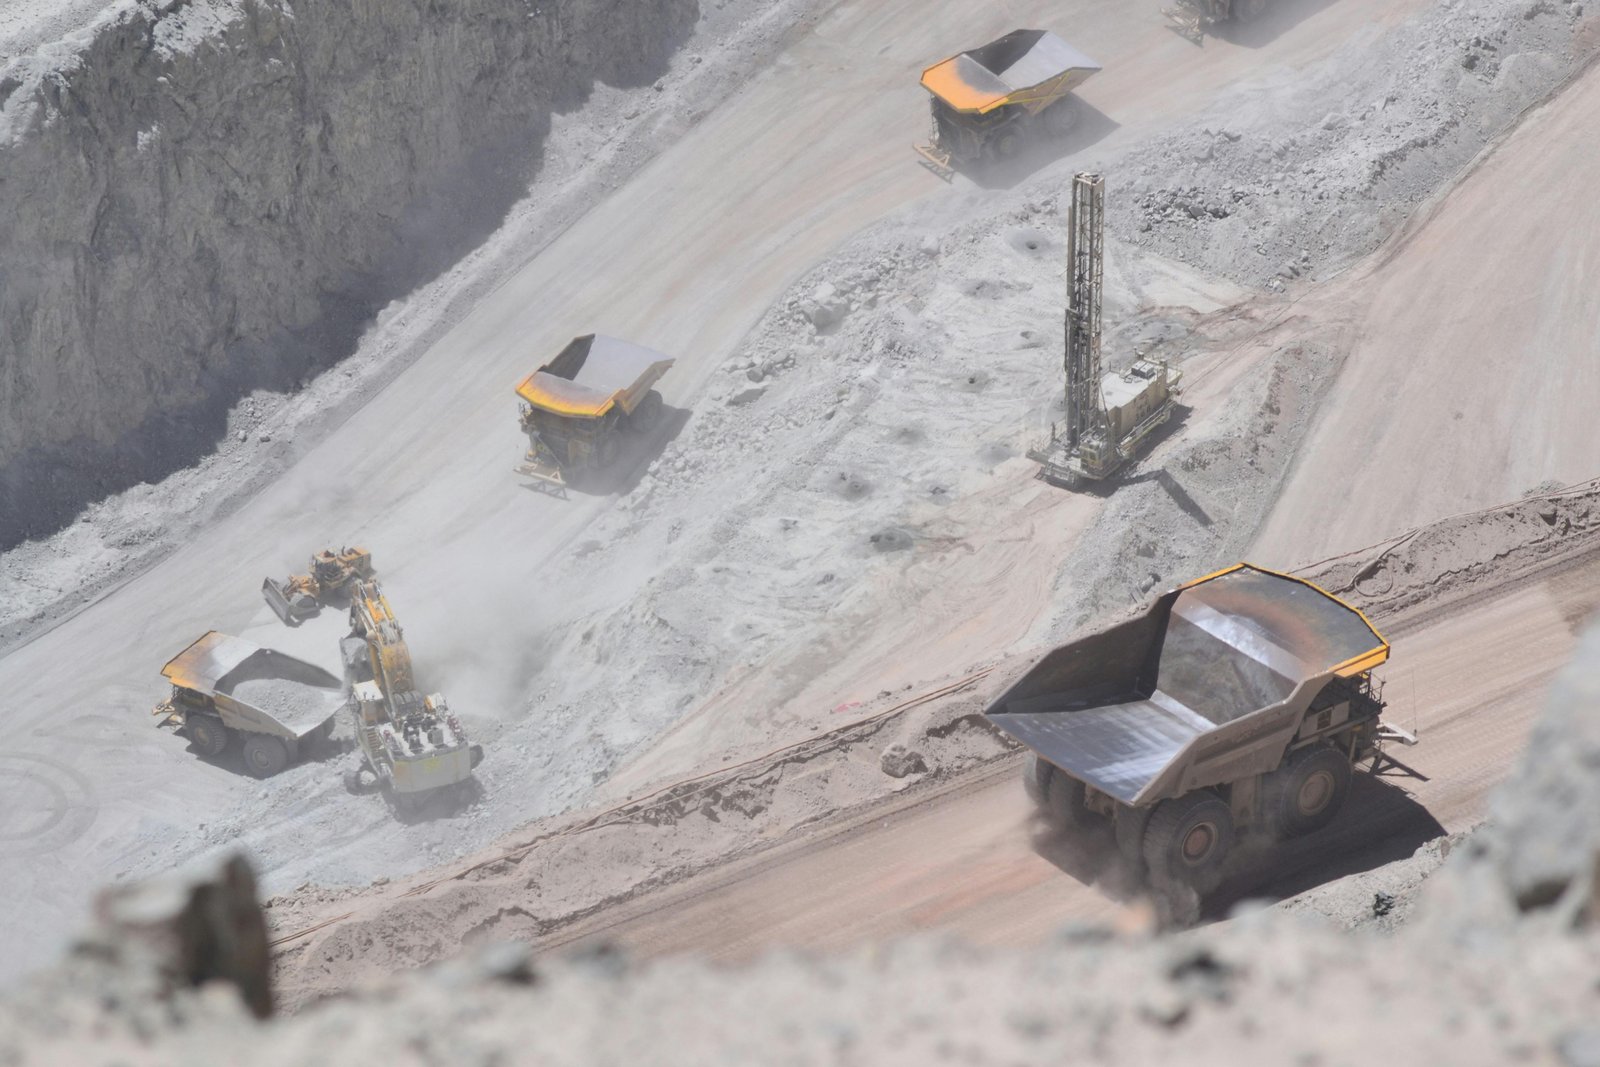
Mine dewatering requirements to maintain dry working conditions in open pits and underground workings create regional hydrogeological impacts extending kilometers beyond mine property boundaries, affecting aquifer sustainability, surrounding water users including communities and agriculture, surface water baseflows supporting aquatic ecosystems, and post-closure pit lake formation with long-term water balance and quality implications. Dewatering challenges stem from mining below water table requiring continuous groundwater removal throughout operational life, with pumping rates driven by aquifer hydraulic properties (transmissivity, storativity), recharge rates from precipitation and surface water infiltration, pit geometry and excavation rate, and effectiveness of barriers or controls limiting inflow such as grout curtains or frozen ground techniques in extreme cases.
Open pit dewatering typically employs in-pit sumps collecting water from pit floor and walls for direct pumping, peripheral dewatering wells surrounding pit creating cone of depression lowering water table below active mining elevation, and horizontal drains installed in pit walls intercepting groundwater before flowing into working areas, with system selection depending on hydrogeological conditions, pit depth and size, and operational constraints. Dewatering rates range from negligible (<100 m³/day) in low-permeability formations to extreme (>50,000 m³/day) in high-transmissivity aquifers, creating proportional infrastructure requirements including pump capacity, power supply, water management systems, and discharge facilities handling volumes that may exceed municipal water supply for nearby towns.
Dewatering Impact Assessment and Mitigation Framework
Phase 1: Baseline Characterization and Predictive Modeling
Hydrogeological Investigation Requirements
→ Aquifer characterization: Test drilling program (10-50+ boreholes depending on mine scale), aquifer pump testing (single-well, multi-well, long-duration 48-168 hours), hydraulic property determination (transmissivity 0.001-1,000 m²/day range typical, storage coefficient 10⁻⁵-0.20), vertical hydraulic connectivity assessment (aquitard presence/properties), spatial heterogeneity characterization (geological controls on permeability)
→ Baseline water levels: Monitoring well network (minimum 15-30 wells for medium operation), quarterly to monthly measurements over minimum 2 years capturing seasonal variability, continuous monitoring at key locations during baseline and operations, establish pre-mining potentiometric surface and gradients
→ Recharge estimation: Water balance modeling combining precipitation (2,000-4,000 mm/year typical Indonesian mining regions), evapotranspiration (800-1,500 mm/year), surface runoff (varies with topography 20-60% of precipitation), and deep infiltration (5-30% reaching aquifer), chloride mass balance or isotope methods validating estimates
→ Surface water-groundwater interaction: Stream gauging establishing baseflow components, seepage studies quantifying gaining vs losing reaches, aquatic ecology baseline documenting flow-dependent habitats
→ Surrounding users inventory: Well census within 5-20 km radius (distance based on preliminary modeling), usage characterization (domestic, irrigation, industrial, livestock), pumping rates and water levels, water quality baseline, dependency assessment (alternative sources available?)
Numerical Groundwater Model Development
→ Model platform selection: MODFLOW or equivalent industry-standard code, 3D finite-difference or finite-element approach, model domain extending 2-5× expected impact radius (typically 10-50 km from pit center)
→ Calibration targets: Baseline water levels (target RMS error <10% of total head range), observed aquifer responses to existing pumping or natural stresses, surface water baseflow rates where data available
→ Predictive scenarios: Progressive mine development (pit deepening phases), dewatering well installations, recharge variations (drought, extreme wet), post-closure recovery simulations
→ Uncertainty analysis: Parameter sensitivity testing (how do transmissivity, recharge uncertainty affect predictions?), multiple realizations with varied inputs (Monte Carlo or equivalent), conservative case (worst reasonable case) predictions for impact assessment
→ Key predictions: Dewatering flow rates throughout mine life (inform pumping infrastructure sizing), cone of depression extent and magnitude at surrounding wells (drawdown predictions at specific receptors), time to impact onset and recovery after closure, pit lake filling rates and final water levels
Phase 2: Impact Mitigation Strategy Selection
| Mitigation Approach | Technical Implementation | Effectiveness and Limitations | Typical Costs |
|---|---|---|---|
| Alternative Water Supply | Provide affected users with alternative supply: deeper wells accessing unaffected aquifer, pipeline from mine dewatering discharge (if quality suitable), connection to municipal/regional system, rainwater harvesting systems for domestic use | Effectiveness: 100% for supplied users Limitations: Capital intensive, perpetual O&M if infrastructure required, may not address ecosystem impacts, users may resist "company water" |
Well replacement: USD 5,000-50,000 per well depending on depth Pipeline: USD 50-200/meter Annual O&M: 5-10% capital cost |
| Managed Aquifer Recharge | Inject treated dewatering discharge into affected aquifer via injection wells or infiltration basins, maintaining water levels outside pit influence zone, requires suitable water quality and receiving aquifer characteristics | Effectiveness: 60-90% mitigation if properly designed Limitations: Requires permeable aquifer, water quality compatibility, clogging management, regulatory acceptance challenges, may not work in heterogeneous systems |
Injection wells: USD 100,000-500,000 per well Infiltration basins: USD 20-100/m² basin area Treatment (if needed): USD 0.10-2.00/m³ O&M: USD 0.05-0.30/m³ recharged |
| Hydraulic Barriers | Grout curtains creating low-permeability barriers reducing inflow, frozen ground walls (in extreme cases), sheet pile or diaphragm walls, horizontal directional drilling for grout placement | Effectiveness: 30-80% inflow reduction depending on geology and barrier completeness Limitations: Very expensive, difficult verification, may not achieve complete cutoff in fractured or karst terrain, limited to specific geometries |
Grout curtain: USD 200-800/meter depth-meter Full pit perimeter: USD 5-50 million depending on depth and perimeter length Frozen ground: USD 500-2,000/m³ frozen volume (extreme cost, rare application) |
| Compensation Programs | Financial compensation for water level decline impacts: payment for deeper wells, increased pumping costs, crop yield reductions, water purchase from alternative sources, compensation formula based on drawdown magnitude and use type | Effectiveness: Addresses socioeconomic impacts but not environmental (ecosystem) impacts Limitations: Complex administration, potential for disputes, does not prevent physical impact, perception issues ("buying permission to harm") |
Highly variable by number of affected parties and impact magnitude Typical: USD 100,000-5,000,000 total over mine life Requires clear agreement framework and dispute resolution mechanism |
| Operational Controls | Modify mine plan to reduce dewatering: optimize pit limits avoiding high-inflow zones, accelerate mining of wet zones early in life (shorter dewatering duration), backfill progressive excavations reducing active dewatering area, seasonal mining scheduling (avoid wet season excavation in high-recharge zones) | Effectiveness: 10-40% reduction in peak dewatering typically achievable Limitations: May impact mine economics (leaving ore behind, constraining sequence), requires early integration in mine planning, limited applicability in some deposits |
Primarily planning cost, minimal direct cost increment Potential opportunity cost if mine plan sub-optimized: USD 0.10-2.00/t ore depending on constraints imposed Usually most cost-effective approach where applicable |
Phase 3: Adaptive Management and Monitoring
- Performance monitoring network: Maintain and expand baseline monitoring wells (quarterly to monthly measurements), install additional wells if impacts extend beyond predicted areas, automated telemetry for key sentinel wells enabling rapid response, surface water flow monitoring at sensitive locations
- Trigger levels and responses: Define specific drawdown thresholds at receptor locations triggering management actions (e.g., >3 m drawdown at community well cluster initiates alternative supply investigation, >5 m triggers provision), pre-agreed response framework with regulators and stakeholders avoiding disputes when triggers reached
- Model updating: Annual model recalibration incorporating operational dewatering data and observed responses, revised predictions for remaining mine life and closure, update mitigation plans if predictions change materially from original assessment
- Stakeholder engagement: Regular communication with affected communities (quarterly meetings typical), transparent data sharing (monitoring results posted publicly), grievance mechanism for impact claims, proactive outreach before impacts manifest rather than reactive responses after problems develop
Problem Category 3: Water Balance Management and Seasonal Variability
Mine water balance management addresses fundamental challenge of matching water availability against operational demands across temporal scales from daily operational needs to seasonal variations to multi-year climate cycles, while simultaneously managing excess water requiring discharge during wet periods and potential shortages threatening operations during drought. The complexity stems from multiple competing water uses within mining operations including dust suppression requiring 5-50 L/second depending on operation scale and climate, ore processing consuming 0.5-2.0 m³ per tonne ore processed for crushing, grinding, flotation or other beneficiation, equipment washing and cooling, potable and sanitary water for workforce typically 50-150 L/day per employee, and fire protection systems requiring emergency reserves, all set against highly variable water sources from dewatering discharge, precipitation and runoff collection, surface water abstraction where permitted, and groundwater wells, each with distinct quality characteristics, reliability, and regulatory constraints.
Table 2: Mine Site Water Balance Components and Management Challenges
| Water Balance Component | Typical Magnitude and Variability | Operational Challenges | Management Strategies |
|---|---|---|---|
| Precipitation Inputs | Indonesia: 2,000-4,000 mm/year typical Seasonal: 70-90% during wet season (Oct-Apr) Inter-annual: ±20-40% variation Extreme events: 100-300 mm in 24 hours possible |
Wet season excess requiring management (storage, treatment, discharge), extreme events causing flooding and erosion, dry season shortages, ENSO (El Niño/La Niña) creating multi-year droughts or floods | Storage ponds sized for 1:20 to 1:100 year 24-hour rainfall event (50,000-500,000 m³ typical for medium operations), emergency spillways preventing embankment overtopping, water level management maintaining freeboard, seasonal discharge timing (wet season when dilution available) |
| Evaporation Losses | Open water: 1,200-1,800 mm/year Seasonal: higher dry season (lower humidity) Tailings surface: 800-1,200 mm/year (lower due to solids cover reducing effective surface area) |
Significant water loss from ponds and tailings (20-40% of precipitation in some cases), concentrates dissolved solids in recycled water affecting process chemistry, seasonal variability complicates water balance predictions | Minimize open water surface area (consolidate ponds, avoid multiple small ponds), floating covers or shade structures for critical water storage (expensive, typically reserved for treated water or potable reserves), account in water balance model (use pan evaporation or meteorological data-based estimates) |
| Process Water Consumption | Ore processing: 0.5-2.0 m³/tonne ore (highly variable by process type) Dust suppression: 5-50 L/second Relatively consistent year-round (follows production schedule) |
Continuous demand regardless of seasonal water availability, water quality requirements varying by use (process water can tolerate higher TDS than dust suppression affecting vegetation), prioritization during shortages (process vs dust suppression vs discharge obligations) | Maximize water recycling from tailings (70-85% recovery typical via decant system or pumping), treat and reuse dewatering discharge if quality suitable (may require basic treatment for suspended solids or metals), optimize process water circuits minimizing makeup demand, prioritize uses during drought (essential process > dust suppression > non-critical) |
| Dewatering Discharge | Highly variable: 500-50,000 m³/day depending on hydrogeology May decline over mine life (cone of depression establishes) or increase (pit deepens into higher permeability zones) Quality variable: clean to contaminated |
May exceed operational needs creating excess requiring discharge (permitting challenges, environmental impacts), quality may require treatment before use or discharge (cost, complexity), reliability issues if pumps fail or seasonal recharge changes affect yield | Use as primary water source where quality permits (often suitable for dust suppression, sometimes process water with basic treatment), excess discharged under permit (requires discharge point, quality standards compliance, monitoring), storage for use during pump maintenance or emergencies, quality management via source blending or treatment |
| Tailings Pond Seepage | Typically 1-10% of impounded volume annually Varies with dam foundation permeability, liner presence/integrity, hydraulic head May contain process chemicals, elevated TDS, metals |
Environmental impact to groundwater or surface water if uncontrolled, represents water loss from tailings facility complicating balance, quality typically requires treatment if captured, increases over time as tailings facility grows (larger wetted perimeter, higher head) | Liner systems during construction (clay, HDPE, composite) limiting seepage to <0.1-1% of volume, seepage collection systems (underdrains, perimeter wells) capturing and recycling or treating seepage, phreatic surface management in tailings (operating at lower water levels reduces head driving seepage), monitoring piezometers confirming collection system effectiveness |
| Runoff from Disturbed Areas | 10-50% of precipitation becomes runoff depending on slope, soil compaction, vegetation Mine haul roads: 40-70% runoff (highly compacted) Waste dumps: 20-40% Rehabilitated areas: 10-25% |
Sediment loading (erosion from active areas), potential contamination from waste rock or spills, large volumes during intense rainfall requiring routing and storage, lack of runoff during dry season (no contribution to water balance) | Clean water diversions routing uncontaminated upslope runoff around operational areas (reduces volumes requiring management), sediment ponds for contact water settling suspended solids before reuse or discharge, erosion control (vegetation, rock armoring, slope grading) minimizing sediment generation, segregation by quality (clean vs contact water) enabling differential management |
Effective water balance management requires dynamic modeling updating monthly or quarterly with actual precipitation, production rates, and measured flows, enabling forward predictions of storage levels, discharge volumes, and potential shortages. Most mining operations develop water balance models in spreadsheet format for operational use, while sophisticated operations employ specialized software (GoldSim, WATSIM, etc.) enabling probabilistic analysis accounting for uncertainty in future precipitation and operational parameters. Key performance indicators include: storage pond levels maintained between minimum (ensuring operational reserves) and maximum (maintaining flood protection freeboard) targets, discharge compliance (staying within permitted volumes and quality), water recycling efficiency (>70-85% tailings water recovery typical target), and supply reliability (zero production stoppages due to water shortages).
Problem Category 4: Water Treatment System Design and Optimization
Mine water treatment addresses diverse contaminants including acidity (pH 2.0-5.0), metals (iron, aluminum, manganese, copper, zinc, nickel, others depending on ore mineralogy), suspended solids (from erosion or process activities), nutrients (nitrogen, phosphorus from blasting residues or wastewater), metalloids (arsenic, selenium, antimony), and dissolved salts (sulfate, chloride, total dissolved solids) each requiring specific treatment approaches or combination technologies achieving discharge standards while balancing capital costs typically USD 1-50 million depending on flow rate (100-10,000 m³/day range typical) and chemistry complexity, operating costs USD 0.20-5.00 per cubic meter treated, and reliability requirements preventing discharge violations that trigger regulatory enforcement and potential operational curtailment.
Active Treatment Technology Selection Decision Framework
Step 1: Characterize Water Quality and Treatment Objectives
| Contaminant Category | Typical Range in Mine Water | Discharge Standard (Indonesia) | Primary Treatment Approach |
|---|---|---|---|
| Acidity (low pH) | pH 2.0-5.0 Acidity 100-5,000 mg/L as CaCO₃ |
pH 6.0-9.0 (Mining effluent standards) |
Lime/limestone neutralization, dosing to pH 8.0-9.0 precipitating metals as hydroxides, alternatives: caustic soda (NaOH), soda ash (Na₂CO₃) for specific applications |
| Iron (Fe total) | 50-5,000 mg/L (highly variable) |
5 mg/L typical (may be 2-10 mg/L depending on receiving water class) |
Oxidation + pH adjustment (ferrous to ferric at pH >5-6, precipitates as Fe(OH)₃ at pH >7), aeration/oxidation ponds, chemical oxidants (H₂O₂, chlorine) if rapid treatment needed |
| Manganese (Mn) | 5-200 mg/L | 2-4 mg/L | More challenging than Fe: requires pH >9.0-9.5 and oxidation, often cascade aeration + high pH or chemical oxidants (permanganate, ozone), biotreatment (manganese-oxidizing bacteria) emerging technology |
| Copper, Zinc, Nickel | 1-500 mg/L depending on ore type | Cu: 2 mg/L Zn: 5 mg/L Ni: varies 0.2-1.0 mg/L |
Hydroxide precipitation at pH 9-10 (co-precipitates with Fe), sulfide precipitation (more selective but requires sulfide dosing, lower pH 7-8 possible), ion exchange or adsorption for polishing to low concentrations |
| Suspended Solids | 50-5,000 mg/L (erosion, precipitates) | 50-200 mg/L depending on use class | Settling ponds (2-24 hour retention), coagulation-flocculation (alum, ferric, or polymer) enhancing settling, filtration (sand, multimedia) for polishing |
| Sulfate | 500-20,000 mg/L | Often no limit, but some jurisdictions 400-1,000 mg/L for specific water classes | Biological sulfate reduction (BSR) using organic carbon source creating sulfide which precipitates metals, reverse osmosis (expensive), ettringite precipitation (lime + aluminum) |
Step 2: Treatment Technology Options and Selection Criteria
High-Density Sludge (HDS) Process for AMD Treatment
Most common active treatment for high-acidity, high-metals mine water; evolution of conventional lime neutralization improving performance and reducing sludge volumes
Process Description:
- Stage 1 - Lime Addition: Lime slurry (10-20% solids) added to reactor tank with vigorous mixing, raising pH to 9.0-10.5, metals precipitate as hydroxides: Fe(OH)₃, Al(OH)₃, Cu(OH)₂, Zn(OH)₂, Mn(OH)₂ (at high pH)
- Stage 2 - Sludge Recirculation: Key innovation - recirculate 2-10 times process sludge mass relative to influent solids, provides nucleation sites for crystal growth creating dense particles settling rapidly, reduces fresh sludge production 30-50% vs conventional
- Stage 3 - Aeration/Oxidation: Air injection oxidizing remaining ferrous to ferric (complete Fe removal), oxidizes manganese at high pH enabling precipitation
- Stage 4 - Flocculation: Polymer addition (anionic, typically 0.5-3 mg/L) enhancing floc formation and settling
- Stage 5 - Clarification: Large clarifier (surface overflow rate 0.5-1.5 m/hour), underflow sludge (15-30% solids) split between recirculation and waste, overflow to polishing
- Stage 6 - Polishing: Final pH adjustment if needed, filtration or additional settling removing residual suspended solids
Performance and Economics:
- Treatment efficiency: Reduces Fe from 1,000+ mg/L to <2-5 mg/L, most other metals to <0.1-1 mg/L, achieves pH 6.5-8.5, handles flows 50-10,000 m³/day typical range
- Sludge production: Typically 2-8 kg dry solids per m³ treated (depends on influent acidity and metals), 30-50% less than conventional neutralization due to sludge recycle
- Chemical consumption: Lime dose 1-10 kg/m³ depending on acidity (calculate from stoichiometry + 10-30% excess), polymer 0.5-3 g/m³
- Capital cost: USD 1-10 million for 500-5,000 m³/day system (highly variable with site conditions, materials of construction)
- Operating cost: USD 0.50-3.00/m³ typical (lime USD 0.20-1.50/m³, polymer USD 0.05-0.15/m³, power USD 0.10-0.40/m³, labor/maintenance USD 0.15-0.95/m³)
Passive Treatment Systems for Low-Flow Applications
Alternative to active treatment for flows <500-1,000 m³/day and moderate contamination; leverages natural processes minimizing operational requirements
Technology Options:
- Aerobic wetlands: Shallow (<0.5 m) vegetated wetlands, oxygen from atmosphere and plant roots enables Fe oxidation and precipitation, requires circumneutral pH (>5.5), design loading <10-20 g Fe/m²/day, retention time 1-3 days, land area requirement 50-500 m² per L/s flow
- Anaerobic wetlands (compost wetlands): Thick (0.5-1.0 m) organic substrate (compost, wood chips, manure) creating reducing conditions, sulfate-reducing bacteria generate alkalinity and precipitate metals as sulfides, handles acidic water pH 3-6, design loading 3-10 g acidity/m²/day, requires 100-1,000 m² per L/s
- Open limestone channels (OLC): Limestone gravel beds, water flows through dissolving limestone generating alkalinity, effective only if pH >4.5-5.0 and low Fe (<20-30 mg/L), otherwise armors with Fe coatings, loading rate 50-200 g acidity/m²/day, requires periodic replacement (armoring) every 1-5 years
- Successive alkalinity producing systems (SAPS): Combines anaerobic wetland (generates alkalinity and reduces Fe to soluble ferrous) with limestone bed (submerged avoiding armoring) and aerobic wetland (oxidizes and precipitates Fe), handles lower pH and higher Fe than simple systems, complex construction but lower long-term O&M
- Vertical flow reactors: Upflow through organic substrate and limestone, compact footprint, good for limited land area, design loading 10-50 g acidity/m²/day
Applicability and Limitations:
- Flow limitations: Generally economical only for <100-500 m³/day; larger flows require excessive land area (multi-hectare wetlands impractical in many settings)
- Climate constraints: Cold climates reduce biological activity; freezing damages systems; tropical climates generally favorable but vegetation selection critical
- Contaminant limitations: Work best for Fe, Mn, moderate acidity; less effective for Cu, Zn, Ni (though some removal occurs via sulfide precipitation in anaerobic zones); not effective for sulfate removal (unless BSR component designed specifically)
- Performance variability: Seasonal fluctuations, vegetation establishment lag (6-18 months to full performance), sensitive to flow and load variability, require careful design and realistic expectations
- Capital cost: USD 50,000-500,000 for system treating 10-100 m³/day (highly site-specific, depends on earthworks requirements)
- Operating cost: USD 0.05-0.50/m³ (primarily vegetation management, sediment removal, limestone replacement), major advantage vs active treatment
- Long-term liability: Not truly "passive" - require perpetual maintenance and monitoring, but much less intensive than active treatment; suitable for post-closure where operational oversight ends but some maintenance possible
Treatment technology selection requires site-specific evaluation considering water quality (pH, metals, flow), treatment objectives (discharge standards, reuse quality requirements), available land area (passive systems need large footprint), climate (affects biological processes), operational capacity (active systems need skilled staff, reagent supply chains), economic constraints (capital budget, acceptable operating cost), and closure planning (ability to operate and maintain systems post-closure). Many operations employ hybrid approaches: active treatment during operations handling peak flows and variable chemistry, transitioning to passive polishing or low-flow treatment at closure reducing perpetual costs while maintaining compliance.
Problem Category 5: Tailings Management and Seepage Control
Tailings storage facilities represent mining's largest water management challenge from both quantity and quality perspectives, storing billions of tonnes of finely ground processed ore residues mixed with process water creating permanent water balance and geochemical management obligations. Modern tailings facilities operate as complex water management systems where water arriving with tailings slurry (typically 30-60% solids by mass) must be recovered for recycling to processing plant, seepage through embankment and foundation must be minimized and captured preventing environmental impacts, and surface water (precipitation, runoff) requires management maintaining pond levels between operational minimum (ensuring supernatant water for reclaim) and maximum (preserving flood protection freeboard preventing overtopping) while accounting for evaporation losses and seasonal variability creating net accumulation during wet season requiring active management through discharge or increased recycling.
Tailings Facility Water Management Checklist and Optimization Protocol
Design Phase Requirements:
☐ Foundation Characterization and Seepage Prediction
☐ Geotechnical investigation: minimum 10-20 boreholes for initial cell, spacing 50-150 m grid
☐ Hydraulic testing: packer tests, laboratory permeability on core samples, establish k = 10⁻⁴ to 10⁻⁹ m/s range typical
☐ Seepage modeling: 2D or 3D numerical model (SEEP/W, MODFLOW, or equivalent) predicting seepage rates through foundation and embankment
☐ Seepage criteria: Typically target <0.1-1.0% of impounded volume annual seepage loss
☐ Liner requirement assessment: If foundation k >10⁻⁷ m/s and/or sensitive receptor proximity, liner typically required
• Compacted clay liner (CCL): k <10⁻⁹ m/s, 0.6-1.0 m thickness minimum, requires suitable clay source
• Geomembrane (GM): HDPE 1.5-2.5 mm thickness, requires smooth subgrade preparation, CQA essential
• Composite (GM + CCL): Industry best practice for critical facilities, redundancy, leak detection possible
☐ Seepage collection system: Perimeter underdrain system (gravel drain + perforated pipe), collection sumps, monitoring and pumping capability
☐ Water Balance Design and Storage Capacity
☐ Design basis: Site-specific water balance model accounting for:
• Tailings water inflow: Production rate × tailings mass yield × (1-solids fraction) = typical 50-70% water by mass
• Precipitation onto pond surface: Area × annual rainfall
• Evaporation loss: Open water area × evaporation rate (meteorological data)
• Seepage loss: Modeled through dam and foundation (see above)
• Water recovery: Decant/reclaim system pumping capacity and target recovery rate (70-90% of inflow typical)
☐ Storage volume requirement: Accommodate extreme events (1:100 year or 1:1000 year 72-hour rainfall depending on consequence class) plus seasonal accumulation
☐ Freeboard specification: Minimum 1.0-3.0 m depending on regulatory requirements and dam consequence classification, maintained at all times including extreme events
☐ Spillway design: Emergency spillway sized for probable maximum flood (PMF) or 1:10,000 year event preventing overtopping
☐ Operating range: Define normal pool elevation range (minimum for decant intake depth, maximum for freeboard) guiding operational water level management
Operational Phase Monitoring and Management:
☐ Daily Operational Monitoring
☐ Pond level: Staff gauge and/or automated level sensor, daily readings, maintain within operating range
☐ Decant system: Flow rate measurement (reclaim volume to process plant), ensure adequate suction head, prevent air entrainment
☐ Seepage collection: Flow measurement from collection system (if present), visual inspection for new seeps in embankment or downstream areas
☐ Embankment condition: Visual inspection for slumping, cracking, wet areas, vegetation stress, erosion gullies
☐ Freeboard calculation: Current pond level vs embankment crest elevation, verify compliance with minimum requirements
☐ Water Quality and Geochemical Monitoring
☐ Supernatant pond water: Monthly sampling minimum, parameters: pH, EC, TDS, major ions, metals suite, process chemicals if used (cyanide, flotation reagents)
☐ Seepage quality: Monthly to quarterly sampling at collection points and downstream monitoring wells, compare to baseline establishing trends
☐ Pore water: Annual to quarterly piezometer sampling (if installations present) characterizing pore water chemistry within tailings mass
☐ Compliance monitoring: Discharge quality if permitted discharge from facility, confirm meeting effluent standards
☐ Geochemical stability: Assess for acidification (declining pH, increasing sulfate/metals suggesting sulfide oxidation), adjust management if deterioration detected (may require enhanced seepage control, water cover planning for closure)
☐ Water Balance Operational Management
☐ Monthly water balance reconciliation: Actual inflows (tailings, precipitation) vs outflows (evaporation, seepage, recovery) vs pond level change, identify discrepancies indicating unaccounted losses or gains
☐ Forward projection: 3-6 month forward prediction using historical precipitation climatology, planned production rates, projected evaporation, informing management actions
☐ Wet season management: Increase reclaim rates maximizing recovery before wet season, potential controlled discharge under permit (if available) reducing stored volume, readiness for extreme rainfall events
☐ Dry season management: Minimize decant to conserve water, potential makeup water requirements if pond drawn below minimum operating level affecting plant water supply
☐ Trigger levels: Establish action levels (e.g., pond exceeds 80% of capacity triggers enhanced reclaim and discharge preparation, <20% of capacity triggers conservation mode reducing non-essential recycling)
Closure Phase Planning and Implementation:
- Final landform design: Determine final profile (slopes, drainage), revegetation strategy, surface water management (channels diverting runoff, preventing erosion), long-term stability (resist erosion over centuries)
- Water cover evaluation: If oxidation risk (sulfidic tailings), assess subaqueous storage covering tailings with water layer >1-3 m depth limiting oxygen diffusion, requires permanent water source (pit lake integration, perpetual makeup) and acceptable for land use objectives
- Dry cover design: If water cover not viable, engineered soil cover limiting infiltration and oxygen diffusion (store-and-release cover in humid climates, oxygen barrier cover in arid), thickness 0.5-3.0 m depending on climate and oxidation risk
- Pore water management: Drainage of excess pore water (may take years to decades), treatment of decant water as pore water consolidates and releases (often contaminated), eventual transition to passive seepage management
- Seepage monitoring: Perpetual monitoring of seepage quality and quantity, contingency treatment capability if deterioration occurs, financial assurance for long-term monitoring and maintenance
- Final discharge closure: If discharge permitted during operations, transition plan to eliminate discharge or reduce to levels sustainable post-closure (natural runoff levels only), final discharge permit modifications
Problem Category 6: Mine Closure Water Management and Pit Lake Formation
Post-closure water management represents mining's most enduring challenge, with obligations extending decades to centuries after operations cease and revenue generation ends, requiring perpetual care and financial resources addressing pit lake water balance and quality, ongoing treatment of contaminated seepage, monitoring networks confirming environmental protection, and adaptive management responding to unexpected developments or changing regulatory expectations. The transition from operational to closure water management fundamentally alters system dynamics as dewatering pumping ceases allowing groundwater recovery flooding mine workings and potentially creating pit lakes, cover systems replace active waste management limiting but not eliminating infiltration and oxidation, treatment systems require redesign for lower flows but potentially deteriorating quality as oxidation products mobilize, and responsibility shifts from operational staff to closure teams or external custodians perpetually managing sites.
Table 3: Pit Lake Development Scenarios and Water Quality Outcomes
| Pit Lake Scenario | Water Balance and Filling Characteristics | Predicted Water Quality Evolution | Management Implications and Options |
|---|---|---|---|
| Scenario A: Rapid Fill, Good Quality | High groundwater inflow (>1,000 m³/day), positive precipitation-evaporation balance, fills to overflow 5-20 years Final water level: Overflow elevation (natural spillway) |
Dilution by clean groundwater influx, limited oxidation time during filling, circumneutral pH 6-8, metals generally low meeting aquatic standards Stratification possible (thermal, chemical) affecting oxygen |
Positive outcome: Lake suitable for recreation, aquatic ecosystem, beneficial use (irrigation, wildlife habitat) Management: Overflow discharge requires permit and monitoring, riparian habitat development, potential fishery establishment, long-term monitoring confirming stability |
| Scenario B: Slow Fill, Degraded Quality | Low groundwater inflow (<500 m³/day), high evaporation, fills very slowly 20-100+ years or never reaches overflow Final level: Below overflow, equilibrium between inflow and evaporation |
Extended oxidation period during slow filling, wall rock weathering and AMD generation, progressive acidification pH 3-5, elevated metals (Fe, Al, Cu, Zn hundreds mg/L), high sulfate and TDS Evaporative concentration worsening quality |
Problematic outcome: Severely degraded water unsuitable for any beneficial use, potential groundwater contamination source Management options: Accelerated filling via diversion of external water (streams, treated mine water), in-lake treatment (dosing alkalinity/neutralizing agents), containment preventing discharge, perpetual monitoring and contingency treatment if seepage impacts detected |
| Scenario C: Terminal Lake (no overflow) | Moderate inflow balanced by evaporation, fills to stable level below overflow 10-40 years, no surface discharge Final level: Determined by evaporation rate and inflow, varies seasonally ±1-3 m |
Quality depends on pit wall geochemistry and filling rate: May range from acceptable (circumneutral, moderate TDS) to poor (acidic, high metals) Evaporative concentration progressively increases TDS over decades (salinity creep) |
Mixed outcome: No discharge simplifies regulatory closure (no perpetual effluent permit), but limited beneficial use due to rising salinity Management: Monitor water quality trends, manage as wildlife habitat if quality adequate, contingency plans if quality deteriorates requiring intervention, financial assurance for perpetual monitoring |
| Scenario D: Meromictic Stratification | Deep pit (>50-100 m final water depth), thermal or chemical density gradients prevent mixing Permanent stratification: Surface layer (mixolimnion) overlying dense bottom layer (monimolimnion) |
Surface layer may have acceptable quality (contact with atmosphere, photosynthesis by algae), bottom layer becomes anoxic, accumulates dissolved metals, sulfide, ammonia from decomposition Stability depends on density difference and wind mixing energy |
Complex outcome: Surface usable but bottom toxic; risk of mixing event (overturn) releasing bottom water affecting whole lake Management: Detailed limnological study characterizing stratification, monitoring for stability changes, use restrictions (no activities disturbing stratification), contingency aeration or treatment if overturn risk develops |
| Scenario E: Backfilled Pit (no lake) | Complete or partial backfilling with waste rock, tailings, or imported material, minimal void space remaining Groundwater recovery to pre-mining levels over years-decades |
Water quality depends on backfill geochemistry: PAF backfill generates AMD in saturated zone, NAF may allow quality recovery Elevated TDS typical even with NAF due to enhanced leaching of fresh mineral surfaces |
Eliminates pit lake: May simplify closure and land use but doesn't eliminate water quality risk Management: Expensive (backfilling costs USD 2-10/m³), only economic where waste rock available nearby, requires careful backfill sequencing (PAF encapsulated by NAF), groundwater monitoring downgradient, potential need for seepage collection and treatment |
Pit lake prediction requires integrated modeling combining hydrogeological assessment (inflow rates from groundwater recovery, surface water diversions), water balance calculations (precipitation, evaporation, overflow/seepage losses), and geochemical modeling (wall rock weathering rates, AMD generation kinetics, mixing and stratification dynamics). Models typically employ GoldSim, PHREEQC coupled with hydrologic models, or similar tools simulating water quality evolution over 50-200 year timeframes. Uncertainty remains substantial given long prediction period, climate change impacts on precipitation and evaporation, and limited validation data (few completed pit lakes with decades of monitoring), requiring conservative assumptions, sensitivity analysis, and adaptive management frameworks allowing course correction as actual conditions develop.
Problem Category 7: Regulatory Compliance and Stakeholder Management
Regulatory compliance and stakeholder engagement represent critical non-technical dimensions of mine water management, where legal obligations, permit conditions, monitoring requirements, reporting protocols, and community expectations create framework within which technical solutions must operate, often driving decisions more strongly than purely technical or economic optimization would suggest. Indonesian regulatory framework for mine water management continues evolving through Government Regulation PP 22/2021 on Environmental Protection and Management establishing water quality standards, Ministry of Environment and Forestry regulations on wastewater discharge, mining law provisions on environmental management and post-mining obligations, and regional/provincial regulations adding local requirements potentially exceeding national standards, creating complex compliance matrix requiring careful tracking and management.
Mine Water Regulatory Compliance Framework and Best Practices
Key Regulatory Requirements for Indonesian Mining Operations:
| Regulatory Aspect | Requirements and Standards | Compliance Implementation |
|---|---|---|
| Effluent Discharge Standards | PP 22/2021 Mining Wastewater: • pH: 6.0-9.0 • TSS: 200 mg/L • Iron (Fe): 5 mg/L • Manganese (Mn): 4 mg/L • Copper (Cu): 2 mg/L • Zinc (Zn): 5 mg/L • Sulfate: Often no limit nationally but provincial limits 400-1,000 mg/L possible • Total dissolved solids: No national limit, but 2,000-4,000 mg/L in some regions |
Monitoring frequency: Monthly minimum for operational discharges, weekly during upset conditions Sampling protocol: Grab samples at designated discharge points, 24-hour composite for flow-weighted averaging, chain of custody to accredited laboratory Reporting: Quarterly environmental monitoring reports to KLHK (Ministry of Environment), annual compliance certification Exceedance response: Immediate notification within 24 hours, corrective action plan within 7 days, demonstration of compliance restoration within 30 days or face enforcement |
| Groundwater Protection | No specific numerical standards for groundwater in mining context, but general environmental protection principles apply Receiving water quality standards (river, stream) provide indirect groundwater targets where discharge to surface water Best practice: Prevent degradation beyond mixing zone |
Monitoring wells: Minimum 3-6 wells per facility (upgradient baseline, downgradient compliance, lateral boundary), quarterly to semi-annual sampling Trigger levels: Establish site-specific action levels (e.g., 50% of discharge standard, or statistically significant increase above baseline) triggering investigation Remediation: If contamination detected, source control assessment, remedial investigation/feasibility study, corrective action implementation under regulatory oversight |
| Water Abstraction Permits | Surface water: Permit from Ministry of Public Works (river/stream) or provincial/district government (local water bodies) Groundwater: Permit from provincial government, specify abstraction rate, well construction standards Dewatering: Often exempt from general groundwater permits but may require notification and monitoring |
Application requirements: Demonstrate need, assess impacts on other users and environment, monitoring and reporting commitments Limitations: May include seasonal restrictions, minimum flow requirements (ecological flows) in streams, priority allocation (domestic > agriculture > industrial) Renewals: Typically 5-20 year permit terms requiring renewal with updated impact assessment and compliance demonstration |
| Environmental Management Plan (RKL/RPL) | Required for all mining operations, describes water management systems, monitoring programs, mitigation measures Updated periodically (typically 5 years) or with major operational changes Includes post-mining water management and closure plans |
Water management content: Describe all water sources and uses, treatment systems, discharge locations and quality, monitoring networks and schedules, contingency plans for upsets Review and approval: Submitted to KLHK or provincial environmental agency, technical review process 3-6 months, conditions of approval binding Compliance reporting: Semi-annual or annual implementation reports demonstrating RKL/RPL execution, deviations explained with corrective actions |
| Mine Closure Plan (Reclamation Guarantee) | Progressive reclamation during operations, final closure plan including perpetual water management Financial assurance (reclamation guarantee deposit) covering estimated closure costs including water treatment, monitoring, contingencies Updated annually or biennially with cost re-estimation |
Water management cost estimation: Include treatment system construction (active or passive), perpetual O&M costs (present value calculation typically 50-100 years at 2-5% discount rate), monitoring costs (sampling, reporting, maintenance), contingency (typically 20-30% of estimated costs) Example calculation: 100 L/s AMD requiring perpetual treatment, USD 2.00/m³ operating cost, present value 50 years at 3% discount = USD 65 million Guarantee instruments: Cash deposit, bank guarantee, insurance bond, or combinations thereof |
Stakeholder Engagement Best Practices
Community Water Resource Concerns and Communication Strategies
- Baseline documentation: Comprehensive pre-mining water resource inventory (wells, springs, streams, water uses, quality, cultural significance), participatory mapping with community involvement building trust and accuracy, video/photo documentation of baseline conditions
- Accessible communication: Translate technical information into lay language, use visual aids (maps, diagrams, photos), avoid jargon in community presentations, provide Indonesian language materials (not just English technical reports)
- Regular updates: Quarterly community meetings presenting monitoring results, trends, management actions, transparent data sharing (post monitoring results publicly on company website or community boards), proactive communication before problems manifest rather than reactive defense after complaints
- Grievance mechanism: Accessible process for water-related complaints (phone hotline, community liaison officers, suggestion boxes), defined response timeline (acknowledgment within 48 hours, investigation within 14 days, resolution or explanation within 30 days), tracking system documenting all grievances and responses
- Independent verification: Third-party monitoring (NGO, university, or community representatives) validates company data building credibility, split sampling programs (community representatives collect samples alongside company staff sent to independent laboratory)
- Benefit sharing: Where mine water creates benefits (discharge augmenting dry season flows, treated water available for community use), formalize arrangements ensuring equitable access, infrastructure development (wells, water distribution systems) using company resources benefiting communities beyond strict impact mitigation
Regulatory Relationship Management
- Proactive compliance: Exceed minimum requirements where economically feasible building credibility, early consultation on planned changes or permit modifications, voluntary disclosure of issues before regulators discover through inspections
- Transparent reporting: Complete and timely submission of required reports, clear presentation of data and trends, honest discussion of challenges and deviations with corrective actions, avoid data manipulation or selective reporting (inevitably discovered, destroys trust)
- Technical capacity building: Support regulator training and capacity development (workshops, facility tours, information sharing), recognize that knowledgeable regulators make better partners than uninformed skeptics, collaborative problem-solving on complex technical issues
- Long-term relationship: Recognize regulatory oversight continues through closure and post-closure (decades), invest in constructive relationship building trust for future needs, consistent personnel interaction (continuity in company representatives improves relationship stability)
Illustrative Example: Integrated Mine Water Management Implementation
Integrated Water Management Implementation: Large-Scale Coal Mining Operationx
Facility Overview and Water Challenges:
Large-scale coal mining operation in East Kalimantan producing 12 million tonnes annually from multiple open pits, total disturbed area 8,000 hectares including active mining, waste dumps, infrastructure, and progressive reclamation. Regional setting characterized by high rainfall (3,200 mm/year average, highly seasonal with 75% during October-April wet season), undulating topography creating 15+ distinct catchments requiring independent water management, mixed geology including acid-generating black shales interbedded with coal seams and neutral to alkaline overburden units, and sensitive downstream receptors including subsistence agriculture, aquaculture ponds, and small communities dependent on surface water and shallow groundwater.
Water Management Problems Encountered:
| Problem Category | Specific Issues Encountered | Solutions Implemented |
|---|---|---|
| Acid Mine Drainage from Waste Dumps | 3 of 12 waste dumps generated acidic drainage pH 3.5-4.5, Fe 200-800 mg/L, Al 50-150 mg/L, exceeding discharge standards by factors of 40-160× Affected receiving streams showing pH 4.5-5.5 and orange iron staining 2-5 km downstream Community complaints about water quality impacts on aquaculture and livestock |
Source control: Comprehensive ABA program characterizing all overburden units, identified PAF units constituting 15% of total waste mass, implemented segregation program separating PAF waste to dedicated cells with encapsulation by NAF material (2:1 NAF:PAF mass ratio), final engineered cover system (0.8 m compacted clay + 0.3 m topsoil) on completed dumps Treatment: Two HDS treatment plants (500 m³/day and 1,200 m³/day capacity) treating contaminated seepage, achieving discharge quality pH 6.5-7.5, Fe <3 mg/L, Al <1 mg/L Cost: Substantial capital investment in treatment infrastructure and collection systems, with ongoing operating costs typical for facilities of this scale |
| Wet Season Flooding and Sediment Discharge | Extreme rainfall events during monsoon periods exceeded sediment pond capacity causing bypass and uncontrolled discharge episodes Downstream turbidity impacts affected aquaculture and water supply intakes during these events Multiple incidents in early operational period resulted in regulatory attention and community engagement requirements | Infrastructure upgrade: Enlarged sediment pond capacity to higher design storm standards, installed emergency spillways with erosion protection, automated monitoring and alert systems Operational improvements: Proactive pond management before predicted heavy rainfall using weather forecasting, enhanced erosion control measures on active areas, progressive reclamation reducing runoff generation Results: Substantial improvement in discharge control performance following implementation Cost: Major capital improvement program for enhanced water management infrastructure" |
| Dewatering Impacts on Community Wells |
Pit dewatering (average 8,000 m³/day) created groundwater drawdown affecting 12 community wells within 3 km radius Water levels declined 2-8 m causing pump failures, reduced yields, seasonal shortages during dry season Modeling predicted impacts would expand to 25+ wells as mining progressed into deeper, higher-permeability zones" |
Mitigation program: Drilled 12 replacement wells to deeper aquifer unaffected by mining (40-60 m depth vs original 8-15 m shallow wells), installed submersible pumps and distribution piping to households, trained community well committees on maintenance Supplemental supply: Piped treated dewatering discharge to 3 villages for non-potable uses (livestock, gardens, cleaning) reducing demand on replacement wells Monitoring: Quarterly water level and quality monitoring at 18 sentinel wells confirming predictions and triggering additional mitigation if needed Cost: USD 380,000 capital (well construction, pumps, piping), USD 45,000 annual O&M support Outcome: Community acceptance, reduced conflict, positive social license contributions |
| Water Balance Management | Highly variable water availability: wet season excess requiring discharge management (15,000-25,000 m³/day combined dewatering + runoff), dry season deficits threatening dust suppression and equipment washing Unpredictable ENSO effects: El Niño droughts vs La Niña floods creating multi-year variability Complex water quality segregation: clean dewatering discharge, treated AMD, sediment pond water, each with different uses and discharge limitations |
Water management system: Developed comprehensive site water balance model (GoldSim platform) integrating all sources and uses, updated monthly with actual data, 6-month forward predictions guiding management Storage infrastructure: 450,000 m³ total raw water storage across 6 ponds providing 15-25 day operating reserve Discharge management: Wet season controlled discharge under permit (max 10,000 m³/day), dry season zero discharge conserving all water, quality-based routing (clean water direct to plant, treated AMD for less demanding uses) Efficiency measures: Dust suppression optimization (weather-responsive spraying, road surface improvements reducing water demand 30%), equipment washing water recycling (closed-loop system), mine planning integration (avoid high-dewatering zones during dry season) Results: Zero water-related production stoppages 2019-2024, discharge compliance >99.5%, water use intensity reduced 25% per tonne coal (operational efficiency metric) Cost: USD 6.8 million capital (ponds, pumping, automation), USD 0.08/m³ incremental operating cost offset by reliability and compliance benefits |
Integrated System Performance and Lessons Learned:
- Total investment: USD 22 million capital over 5-year implementation period (2018-2023), USD 1.8 million annual operating cost increment, equivalent to USD 1.50 per tonne coal or 2.5% of operating cost - considered acceptable for risk mitigation and compliance assurance
- Compliance performance: Effluent discharge standard compliance improved from 87% (2018 baseline) to 99.6% (2024), zero regulatory enforcement actions since 2021 (vs 3 warnings + 1 administrative sanction 2018-2020), annual environmental audit ratings improved from "adequate" to "excellent"
- Community relations: Water-related grievances declined from 42 cases/year (2018) to 3 cases/year (2023-2024 average), community satisfaction surveys showing 78% approval for water management (vs 35% in 2018), collaborative programs established (community water quality monitoring, dry season supply sharing)
- Key success factors: Senior management commitment and adequate budget allocation, comprehensive baseline characterization enabling predictive management, integrated approach addressing multiple problems systematically rather than piecemeal reactions, proactive stakeholder engagement building trust before crises, skilled technical staff with training and retention programs, adaptive management allowing course corrections based on monitoring feedback
- Continuing challenges: Long-term financial liability for perpetual treatment (estimated present value USD 45-65 million for post-closure AMD treatment over 50 years), climate change uncertainty affecting water balance predictions (trend toward more extreme rainfall events and longer dry seasons), regulatory evolution with progressively stricter standards potentially requiring additional treatment upgrades, aging infrastructure requiring ongoing reinvestment maintaining performance
Transferable Lessons for Indonesian Mining Sector:
Case demonstrates that comprehensive, well-funded, professionally managed water programs can achieve compliance, stakeholder acceptance, and operational reliability despite challenging conditions (high rainfall variability, acid generation potential, sensitive receptors), but requires sustained commitment and integration into core business rather than peripheral "environmental" function. Investment in prevention (source segregation, encapsulation, erosion control) proves more cost-effective than remediation and treatment alone, though combination typically needed. Stakeholder engagement and transparent communication as important as technical solutions for overall success. Closure planning and financial assurance from outset essential given long-term liability magnitude potentially exceeding operational period profitability.
Technical Glossary
Acid-Base Accounting (ABA): Static geochemical testing methodology measuring acid-generating potential (from sulfide minerals) and neutralization potential (from carbonate minerals) of rock materials, expressed in kg CaCO₃ equivalent per tonne, determining net acid-generating or neutralizing capacity
Acid Mine Drainage (AMD): Contaminated water generated by oxidation of sulfide minerals exposed during mining, characterized by low pH (typically 2-5), elevated metals (Fe, Al, Cu, Zn, Mn), and high sulfate concentrations requiring treatment before discharge
Cone of Depression: Cone-shaped decline in water table or potentiometric surface surrounding pumping well or dewatering system, extent determined by aquifer properties, pumping rate, and time, potentially affecting surrounding water users kilometers from source
Dewatering: Continuous pumping of groundwater from mine workings (open pit or underground) maintaining dry conditions enabling safe and efficient excavation, typically ranging 100-50,000 m³/day depending on hydrogeological conditions and mine geometry
High-Density Sludge (HDS): Advanced lime neutralization process for AMD treatment employing sludge recirculation creating dense, rapidly settling particles, reducing sludge production 30-50% compared to conventional neutralization while achieving superior effluent quality
Humidity Cell Test: Kinetic geochemical testing methodology exposing crushed rock sample to repeated wet-dry cycles over 20-52 weeks, measuring leachate chemistry evolution predicting long-term acid generation potential and metal release rates under field conditions
Meromictic Lake: Permanently stratified water body where density differences (temperature, salinity) prevent complete mixing, creating surface layer (mixolimnion) overlying dense bottom layer (monimolimnion) which may become anoxic and accumulate contaminants posing management challenges
Net Neutralization Potential (NNP): Difference between neutralization potential and maximum potential acidity from ABA testing, expressed in kg CaCO₃ equivalent per tonne, with positive values indicating net neutralizing capacity (non-acid forming) and negative values indicating net acid-generating potential
Passive Treatment: Water treatment approach employing natural processes (wetlands, limestone dissolution, bacterial sulfate reduction) with minimal operational intervention, suitable for low-flow applications (<100-500 m³/day) and moderate contamination, requiring large land area but low long-term operating costs
Pit Lake: Water body forming in open pit mine void after operation cessation and dewatering termination, filled by groundwater recovery, precipitation, and runoff, with water quality determined by pit wall geochemistry, filling rate, and water balance, potentially requiring perpetual management
Potentially Acid Forming (PAF): Classification for rock material with insufficient neutralization potential to prevent acid generation, typically NNP <-20 kg CaCO₃/t and NP/MPA ratio <1:1, requiring special management (segregation, encapsulation, covers) preventing oxidation and acid drainage generation
Seepage: Uncontrolled water loss through tailings dam or waste dump foundation and embankment, potentially carrying contaminants to groundwater or surface water, typically 0.1-10% of impounded volume annually depending on foundation permeability and liner effectiveness, requiring collection and treatment or source control through liner systems
Essential Mine Water Management Resources and Technical References
Comprehensive technical documents for mine water problem diagnosis and solution implementation:
INAP: Global Acid Rock Drainage Guide (GARD Guide)
Comprehensive international best practice guide covering AMD prediction, prevention, and treatment with case studies and decision tools
MEND: Mine Environment Neutral Drainage Program (Canada)
Extensive research reports on AMD prediction, prevention, treatment, and monitoring - comprehensive technical library
EPA: Technical Document on Hardrock Mining and Water Resources
United States EPA guidance on mine water management, dewatering impacts, treatment technologies, and closure planning
ICMM: Water Stewardship Framework and Good Practice Guide
International Council on Mining and Metals guidance on sustainable water management integrating technical and stakeholder dimensions
AMIRA: Mine Water Management Research Projects and Reports
Australian collaborative research program publications on dewatering, treatment optimization, and closure water management
Strategic Conclusions and Industry Recommendations
Mine water management represents fundamental mining industry challenge requiring integration of hydrogeology, geochemistry, engineering design, environmental science, regulatory compliance, and stakeholder engagement disciplines addressing problems that persist throughout operational life and extend indefinitely into post-closure period creating perpetual obligations. Successful programs recognize water management not as peripheral environmental function but as core operational requirement affecting production continuity, regulatory license to operate, community acceptance, and long-term financial liability potentially exceeding operational period profitability, thereby requiring senior management attention, adequate budget allocation, and professional technical expertise comparable to other critical business functions.
For Indonesian mining operations, recommended strategic approaches include comprehensive baseline characterization during exploration and feasibility establishing hydrogeological properties, geochemical behavior, and stakeholder dependencies before operational commitments, enabling informed risk assessment and mitigation planning; proactive prevention rather than reactive treatment where technically feasible through source segregation, encapsulation, covers, and operational controls reducing long-term liability and treatment costs; integrated water balance management employing predictive modeling, adequate storage, and adaptive operational strategies maintaining supply reliability while managing excess discharge; robust monitoring networks providing early warning of developing problems enabling timely intervention before major upsets or compliance violations; transparent stakeholder engagement building trust and collaborative problem-solving relationships with communities, regulators, and civil society; realistic closure planning from project outset recognizing perpetual care obligations and establishing adequate financial assurance covering treatment, monitoring, and contingencies; and continuous improvement culture utilizing performance data, emerging technologies, and industry best practices progressively enhancing water management effectiveness and efficiency.
Industry-wide improvements would benefit from enhanced technical capacity building through professional training programs, university partnerships, and knowledge sharing forums disseminating best practices; development of Indonesian-specific guidance documents adapting international methodologies to local geological, climatic, and regulatory contexts with domestic case study examples; strengthened regulatory framework clarification addressing ambiguities in water quality standards, monitoring requirements, and financial assurance calculations promoting consistent industry compliance; research and development on cost-effective treatment technologies suitable for Indonesian conditions including passive systems for tropical climates and treatment optimization for site-specific chemistries; and sector collaboration through industry associations facilitating shared learning, joint research initiatives, and collective advocacy for rational regulatory evolution balancing environmental protection with economic viability supporting sustainable development throughout Indonesian archipelago.

Professional Mine Water Management Consulting and Engineering Services
SUPRA International provides comprehensive mine water management services including geochemical characterization and AMD prediction, hydrogeological investigation and dewatering system design, water balance modeling and optimization, treatment system engineering (active and passive technologies), regulatory compliance support and permitting assistance, stakeholder engagement and grievance management, and mine closure planning with financial assurance development. Our multidisciplinary team combining hydrogeologists, geochemists, environmental engineers, and regulatory specialists supports mining companies, project developers, financial institutions, and government agencies throughout Indonesia delivering practical solutions that achieve compliance, minimize liability, optimize costs, and support sustainable operations and responsible closure.
Facing mine water management challenges requiring expert technical support?
Contact our mining and environment specialists to discuss solutions for acid mine drainage, dewatering impacts, treatment optimization, or closure planning
Share:
If you face challenges in water, waste, or energy, whether it is system reliability, regulatory compliance, efficiency, or cost control, SUPRA is here to support you. When you connect with us, our experts will have a detailed discussion to understand your specific needs and determine which phase of the full-lifecycle delivery model fits your project best.