
Global Trends in Non-Revenue Water (NRW) Reduction: Frameworks, Methodologies, and Implementation Strategies for Urban Water Systems
Global Trends in Non-Revenue Water (NRW) Reduction: Frameworks, Methodologies, and Implementation Strategies for Urban Water Systems
Reading Time: 45 minutes
Key Highlights
• Global NRW Crisis: Approximately 126 billion cubic meters of water lost annually worldwide valued at USD 39-50 billion, with developing countries averaging 40-50% NRW rates compared to 10-15% in developed nations1
• Asia-Pacific Impact: Conservative estimates place Asian NRW at 29 billion cubic meters annually costing USD 8.7 billion, where reducing physical losses by half could provide water for 150 million additional people2
• Success Stories: Phnom Penh reduced NRW from 72% (1993) to 6.2% (2008), Manila East Zone achieved 16.9% by 2009, and Singapore maintains world-leading 4.7% through systematic frameworks and political commitment3
• Technology Integration: Smart water management market projected to grow from USD 23.7 billion (2025) to USD 43.7 billion (2030) at 13% CAGR, driven by IoT sensors, AI analytics, and digital transformation addressing NRW challenges4
• Framework Standardization: IWA Water Balance methodology adopted globally provides standardized structure for NRW assessment, enabling performance benchmarking and targeted reduction strategies across physical and commercial loss components5
Executive Summary
Non-Revenue Water constitutes one of water sector's most pressing global challenges, representing water produced and distributed but generating no revenue due to physical leakage, commercial losses through theft or meter inaccuracies, or unbilled authorized consumption. International estimates indicate approximately one-third of global drinking water supply fails to reach end users or generate revenue, equating to 346 million cubic meters daily or 126 billion cubic meters annually with conservative economic value of USD 39 billion per year.1 This massive loss undermines water utility financial viability, limits infrastructure investment capacity, exacerbates water scarcity in stressed regions, and generates unnecessary energy consumption and greenhouse gas emissions from treating and pumping water ultimately wasted.
Regional variations in NRW performance prove striking, with developed countries typically maintaining 10-15% NRW levels while many developing nations experience 40-50% or higher rates. Sub-Saharan Africa faces particularly acute challenges with countries like Cameroon recording 53% NRW, South Africa reaching 46.4% by 2022, and numerous utilities across region struggling with aging infrastructure, rapid urbanization, insufficient investment, and institutional capacity limitations.6 Asia-Pacific region, despite significant economic growth and urbanization, faces similar challenges with conservative estimates placing annual NRW at 29 billion cubic meters costing water utilities nearly USD 9 billion yearly, though notable success stories from Phnom Penh, Singapore, and Manila demonstrate achievable transformation through systematic approaches and sustained commitment.
International frameworks for NRW management have evolved substantially over past two decades, with International Water Association's standardized Water Balance methodology now widely adopted globally providing consistent terminology, measurement approaches, and performance indicators enabling meaningful comparison across utilities and countries. This framework separates NRW into distinct components including unbilled authorized consumption, apparent losses from theft and metering errors, and real losses from physical leakage in transmission and distribution infrastructure. Understanding these components proves essential for designing targeted reduction strategies, as interventions addressing physical leakage differ fundamentally from those tackling commercial losses or improving meter accuracy.
Technology advancement creates new opportunities for NRW reduction through smart water management solutions integrating sensors, data analytics, and automation. District Metered Areas combined with pressure management systems enable precise leak detection and proactive intervention, while advanced metering infrastructure provides granular consumption data supporting both technical and commercial loss reduction. Artificial intelligence and machine learning applications increasingly support predictive maintenance, optimal pressure control, and early leak detection before failures become catastrophic. These technological solutions complement traditional approaches of infrastructure rehabilitation, active leakage control, and improved customer metering, creating integrated strategies addressing multiple NRW components simultaneously for maximum impact and cost-effectiveness.
This analysis examines global trends in NRW reduction frameworks, methodologies, and implementation strategies, drawing on international best practices, successful case studies, emerging technologies, and lessons learned from diverse contexts. Beginning with standardized IWA Water Balance framework providing foundation for assessment and monitoring, discussion progresses through technical interventions including District Metered Areas and pressure management, explores commercial loss reduction approaches, examines successful transformation examples from Asia-Pacific region, and concludes with emerging trends in digitalization and smart water management. Throughout, emphasis remains on practical implementation considerations, cost-benefit analysis, institutional requirements, and sustainable approaches achieving lasting NRW reduction rather than temporary improvements.
International Water Association Water Balance Framework
The IWA Water Balance represents globally recognized methodology for assessing water losses and managing non-revenue water in utility networks, developed through collaboration of IWA Water Loss Task Force and Performance Indicators Task Force to provide standard approach overcoming previous diversity of formats and definitions that hindered international comparisons. This framework structures comprehensive analysis of water supply from system input through various consumption and loss components to final billed volumes, enabling utilities to understand loss magnitude, identify where losses occur, calculate financial implications, and develop business cases for targeted reduction programs.5
The Water Balance begins with System Input Volume, defined as annual volume entering that part of water supply system to which balance relates, typically measured at water treatment works output or bulk supply meters. This system input divides first into Authorized Consumption representing all water legitimately used whether billed or unbilled, and Water Losses comprising all water lost through leakage or not accounted for through metering or billing processes. Authorized Consumption further separates into Billed Authorized Consumption generating revenue, and Unbilled Authorized Consumption including firefighting, municipal uses, or supply to charitable institutions generating no revenue though legitimately consumed. Understanding this distinction proves critical since unbilled authorized consumption, while part of NRW, requires different management approaches than actual losses.
IWA Water Balance Standard Components:
System Input Volume
• Volume from own sources (treatment plants, wells)
• Water imported from other systems
• Measured by bulk production meters
• Accuracy critical for reliable NRW calculation
• Should be corrected for known errors
Authorized Consumption
• Billed Metered Consumption (revenue generating)
• Billed Unmetered Consumption (estimated charges)
• Unbilled Metered Consumption (operational uses)
• Unbilled Unmetered Consumption (firefighting, municipal)
• All legitimate water use whether billed or not
Water Losses (Non-Revenue Water minus Unbilled Authorized)
• Apparent Losses (commercial losses)
• Real Losses (physical losses)
• Sum equals total water unaccounted for
• Requires different intervention strategies
• Financial impact varies by loss component
Apparent Losses Components
• Unauthorized consumption (theft, illegal connections)
• Customer meter inaccuracies (under-registration)
• Systematic data handling errors
• Billing errors and adjustments
• Typically 40% of NRW in developing countries
Real Losses Components
• Leakage on transmission and distribution mains
• Leakage on service connections up to customer meter
• Leakage and overflows at storage tanks
• Measured at average operating pressure
• Related to infrastructure condition and pressure
Water Losses separate into Apparent Losses and Real Losses, requiring fundamentally different measurement methodologies and reduction strategies. Apparent Losses, sometimes called commercial losses, represent water delivered to customers but not properly measured or billed, including unauthorized consumption through illegal connections, customer meter inaccuracies where meters under-register actual consumption, and systematic data handling errors in billing systems. These losses generate no revenue despite water reaching consumers, and reduction focuses on improving metering accuracy, detecting and eliminating theft, upgrading billing systems, and strengthening enforcement. World Bank estimates indicate apparent losses account for approximately 40% of total NRW in developing countries, often exceeding physical losses in some urban areas.7
Real Losses constitute physical water lost from pressurized system through leakage in transmission mains, distribution networks, service connections, and storage facilities before reaching customer meters. These losses represent actual water wastage requiring different interventions than commercial losses, including infrastructure rehabilitation, pressure management, active leak detection and repair, improved pipeline materials and installation quality, and systematic asset management. Relationship between pressure and leakage proves strong, with research indicating leak flow rates vary approximately with square root of pressure in most distribution systems, making pressure management particularly effective intervention for real loss reduction. Infrastructure Leakage Index developed by IWA provides more appropriate performance indicator than simple percentage, comparing actual real losses to unavoidable real losses given system characteristics including pipeline length, connections, average pressure, and other factors largely beyond utility control.
Water Balance Simulation: Practical Example
Understanding Water Balance concepts proves essential, but practical application through realistic examples clarifies methodology and interpretation. Consider mid-sized urban water utility serving population of 500,000 with 100,000 customer connections across service area of 400 square kilometers with 1,200 kilometers of distribution mains. System operates at average pressure of 60 meters head with water supplied 24 hours daily from combination of treatment plants and groundwater sources. Following example works through complete Water Balance calculation demonstrating how utilities systematically identify and quantify NRW components.
Water Balance Calculation Example: Urban Utility
System Input Data (Annual Volume):
• Water produced from treatment plants: 45,000,000 m³/year
• Groundwater from municipal wells: 10,000,000 m³/year
• Water imported from regional supplier: 5,000,000 m³/year
• Total System Input Volume: 60,000,000 m³/year
Billed Authorized Consumption:
• Billed metered consumption (residential): 25,000,000 m³/year
• Billed metered consumption (commercial): 8,000,000 m³/year
• Billed metered consumption (industrial): 4,000,000 m³/year
• Billed unmetered consumption (estimated): 500,000 m³/year
• Total Billed Authorized Consumption: 37,500,000 m³/year
Unbilled Authorized Consumption:
• Firefighting (measured/estimated): 200,000 m³/year
• Municipal uses (parks, public buildings): 300,000 m³/year
• Distribution system flushing: 150,000 m³/year
• Treatment plant backwashing: 350,000 m³/year
• Total Unbilled Authorized Consumption: 1,000,000 m³/year
Non-Revenue Water Calculation:
NRW = System Input Volume - Billed Authorized Consumption
NRW = 60,000,000 - 37,500,000 = 22,500,000 m³/year
NRW Percentage = (22,500,000 / 60,000,000) × 100 = 37.5%
Water Losses Calculation:
Water Losses = NRW - Unbilled Authorized Consumption
Water Losses = 22,500,000 - 1,000,000 = 21,500,000 m³/year
Water Losses Percentage = (21,500,000 / 60,000,000) × 100 = 35.8%
Apparent Losses Estimation:
• Customer meter inaccuracies (estimated 5% under-registration): 1,875,000 m³/year
• Unauthorized consumption (estimated from surveys): 2,000,000 m³/year
• Billing errors and data handling: 125,000 m³/year
• Total Apparent Losses: 4,000,000 m³/year
• Apparent Losses as % of System Input: 6.7%
Real Losses Calculation:
Real Losses = Water Losses - Apparent Losses
Real Losses = 21,500,000 - 4,000,000 = 17,500,000 m³/year
Real Losses Percentage = (17,500,000 / 60,000,000) × 100 = 29.2%
Real Losses per connection per day = 17,500,000 / (100,000 × 365) = 479 liters/connection/day
Real Losses per km of mains per day = 17,500,000 / (1,200 × 365) = 39,954 liters/km/day
Financial Impact Analysis (assuming water cost USD 0.40/m³):
• Value of NRW: 22,500,000 × USD 0.40 = USD 9,000,000/year
• Value of Apparent Losses: 4,000,000 × USD 0.40 = USD 1,600,000/year
• Value of Real Losses: 17,500,000 × USD 0.40 = USD 7,000,000/year
• Potential revenue from NRW reduction to 20%: USD 3,150,000/year
This example illustrates several critical insights for NRW management. First, utility's 37.5% NRW rate significantly exceeds international best practice targets of 20-25%, indicating substantial opportunity for improvement and financial recovery. Second, real losses (29.2% of system input) dominate over apparent losses (6.7%), suggesting priority interventions should focus on infrastructure improvement, pressure management, and active leak detection rather than commercial loss reduction, though addressing both components remains important. Third, financial analysis demonstrates NRW costing utility USD 9 million annually, with reducing NRW to more acceptable 20% level potentially recovering USD 3.15 million yearly, providing strong business case for systematic reduction program investment.
Real losses expressed in alternative units provide additional performance insights. Value of 479 liters per connection per day significantly exceeds typical developed country performance of 50-100 liters/connection/day, while 39,954 liters per kilometer of mains per day also indicates substantial leakage requiring intervention. These volumetric indicators prove more stable for performance tracking than percentage figures, which vary with consumption patterns and can show apparent "improvement" simply from increased water use rather than actual loss reduction. Infrastructure Leakage Index calculation, comparing actual real losses to minimum achievable losses given system characteristics, would provide even more nuanced performance assessment accounting for factors affecting leakage largely beyond utility control including network density, average pressure, and connection numbers.
Global NRW Statistics and Regional Variations
Non-Revenue Water manifests as global challenge affecting water utilities across all income levels and geographic regions, though performance variations prove substantial reflecting differences in infrastructure age and condition, institutional capacity, financial resources, governance quality, and technical expertise. Comprehensive global assessment remains challenging due to inconsistent measurement methodologies and reporting standards, but available evidence indicates approximately one-third of worldwide drinking water supplied to utilities fails to reach users or generate revenue, representing massive economic, environmental, and social costs that undermine sector sustainability and limit service expansion to unserved populations.
Developed countries typically maintain NRW levels between 10-15% of system input volume, with leading performers achieving even lower rates. United Kingdom, pioneer in systematic water loss management, maintains national average around 18% though some utilities achieve below 15%. Germany reports national average approximately 7%, while Japan maintains levels around 8-10% across major urban utilities. These low NRW rates reflect combination of factors including modern infrastructure regularly maintained and replaced, strong technical capacity, adequate financial resources for proactive interventions, comprehensive metering with high accuracy, strong governance and regulatory frameworks, and continuous performance monitoring with accountability for results. However, even in developed countries, aging infrastructure presents increasing challenges requiring sustained investment in rehabilitation and replacement programs.8
Regional NRW Performance Indicators:
Developed Countries (North America, Western Europe, Japan):
• Average NRW: 10-15% of system input
• Best performers: 5-8% (Singapore, Japan, Germany)
• Primary losses: Real losses from aging infrastructure
• Apparent losses: Minimal, typically below 2-3%
• Main challenges: Infrastructure renewal investment needs
Asia-Pacific Developing Countries:
• Average NRW: 30-40% of system input
• Range: 15% (Manila East) to 70% (Cambodia pre-reform)
• Total volume: 29 billion m³/year (conservative estimate)
• Economic cost: USD 8.7-9 billion annually
• Success stories: Phnom Penh 6.2%, Singapore 4.7%, Manila East 16.9%
• Challenges: Rapid urbanization, investment constraints, capacity limitations
Sub-Saharan Africa:
• Average NRW: 40-50% of system input
• Range: 25% (best performers) to 60% (struggling utilities)
• South Africa: Increased from 35% (2015) to 46.4% (2022)
• Cameroon urban areas: 53% of system input
• Primary challenges: Infrastructure investment, technical capacity, governance
• Apparent losses often exceed real losses due to theft and illegal connections
Latin America and Caribbean:
• Average NRW: 35-45% of system input
• Urban areas generally perform better than rural
• Wide variation between countries and utilities
• Investment constraints limit reduction programs
• Some progressive utilities achieving 20-25% through systematic approaches
Middle East and North Africa:
• Average NRW: 30-50% with high variation
• Lebanon: Approximately 40% NRW
• Water scarcity compounds NRW impact
• Conflict and political instability affect infrastructure
• Investment in modernization gradually reducing losses
Asia-Pacific region presents mixed picture with both success stories and ongoing challenges. Conservative estimates place annual NRW in Asia at 29 billion cubic meters costing water utilities nearly USD 9 billion yearly, assuming modest water value of USD 0.30 per cubic meter.2 Reducing physical losses by half the present level could supply approximately 150 million additional people with already-treated water, illustrating enormous potential social benefit from systematic NRW reduction. Region includes global best performers like Singapore maintaining 4.7% NRW through world-class infrastructure, strong governance, and continuous investment, alongside utilities struggling with rates exceeding 40-50% due to aging infrastructure, rapid urbanization outpacing service expansion, limited financial resources, and institutional capacity constraints.
Sub-Saharan Africa faces particularly acute NRW challenges with many countries experiencing rates of 40-50% or higher. Recent assessment of Cameroon's urban water distribution found total NRW volume of 100.26 million cubic meters per year representing 53% of total system input volume, with cumulative cost calculated at USD 244.6 million between 2019-2022 or USD 61.2 million annually.6 South Africa's "No Drop Watch" report documented NRW increasing from 35% in 2015 to 46.4% by June 2022, well above international average below 30%, with water losses standing at 40.7%. These high loss rates reflect combination of aging infrastructure requiring replacement, insufficient maintenance investment, rapid urbanization creating service expansion challenges, limited technical capacity in many utilities, governance issues affecting operational efficiency, and in some cases high levels of apparent losses from theft and illegal connections due to affordability constraints and limited enforcement.
District Metered Areas: Foundation for Active NRW Management
District Metered Areas represent one of most widely implemented and effective methodologies for systematic NRW reduction, involving division of water distribution network into discrete zones with defined boundaries, limited entry and exit points equipped with flow meters, and hydraulic isolation enabling precise measurement of water entering and leaving each zone. This sectorization approach, pioneered in United Kingdom during 1980s and subsequently adopted globally, transforms network management from passive approach responding only to visible leaks or customer complaints into active management system enabling proactive leak detection, rapid response, pressure optimization, and continuous performance monitoring at manageable scale.9
DMA implementation begins with strategic network analysis identifying optimal zone boundaries based on multiple criteria including topology and natural boundaries like rivers, railways, or major roads, elevation variations and pressure requirements, existing valve locations and pipeline configurations, customer density and connection numbers typically 500-3,000 properties per DMA, operational considerations for isolation and emergency response, and metering requirements balancing accuracy with implementation costs. Well-designed DMAs minimize number of boundary valves requiring closure for isolation while maintaining adequate redundancy for emergency supply, utilize existing infrastructure where possible to reduce costs, and consider future network expansion and development patterns avoiding need for frequent reconfiguration.
DMA Design and Implementation Framework:
Planning and Design Phase:
• Network analysis using GIS and hydraulic modeling
• Optimal zone boundary identification
• Size determination (typically 500-3,000 connections)
• Elevation and pressure zone consideration
• Entry/exit point selection and metering strategy
• Cost-benefit analysis and prioritization
• Implementation sequencing and phasing plan
Physical Implementation:
• Boundary valve installation or closure
• Flow meter installation at entry/exit points
• Telemetry and data logging equipment
• Pressure monitoring points establishment
• Network hydraulic verification testing
• As-built documentation and GIS updates
• Operator training on DMA management
Operational Monitoring:
• Continuous flow and pressure data collection
• Minimum Night Flow (MNF) analysis
• Night consumption estimation and baseline
• Leakage calculation by subtraction method
• Performance indicator tracking over time
• Comparison with other DMAs and benchmarks
• Prioritization of DMAs requiring intervention
Leak Detection and Repair:
• Acoustic leak detection surveys
• Correlating loggers for precise localization
• Rapid repair response protocols
• Leak repair quality assurance
• Post-repair flow verification
• Documentation and asset register updates
• Economic level of leakage assessment
Performance Management:
• Regular water balance calculation
• Infrastructure condition assessment
• Pressure management optimization
• Customer meter testing and replacement
• Apparent loss reduction initiatives
• Asset management integration
• Continuous improvement programs
Once DMAs established, systematic monitoring focuses primarily on Minimum Night Flow analysis, leveraging fact that water demand typically reaches minimum during early morning hours (typically 2-4 AM) when customer usage remains low and consistent, meaning flow into DMA during this period primarily represents leakage plus small legitimate night consumption. MNF measurement requires continuous flow monitoring with data logging at 15-minute or finer intervals, enabling precise identification of minimum flow periods and tracking of changes over time indicating new leaks or successful repairs. Legitimate night consumption estimation based on studies of actual customer usage patterns, number and type of connections, and presence of commercial or industrial users with continuous demand enables calculation of leakage component by subtracting estimated night consumption from measured minimum night flow.
Calculated leakage levels enable prioritization of DMAs for active leak detection surveys using acoustic equipment including listening sticks for exposed fittings, ground microphones for buried pipes, and correlation techniques precisely locating leaks between two sensors. High-leakage DMAs receive priority attention with systematic surveys covering all pipelines identifying both reported and unreported leaks for repair. Economic analysis comparing leak repair costs with water value determines Economic Level of Leakage guiding optimal intervention intensity, recognizing that complete leak elimination proves neither technically feasible nor economically justified, with optimal management targeting balance between intervention costs and water loss value. Progressive utilities implement continuous monitoring with automated alerts when flows exceed expected ranges, enabling rapid response before leaks escalate into major failures.
Pressure Management for Real Loss Reduction
Pressure management constitutes single most cost-effective intervention for real loss reduction in many water distribution systems, exploiting strong relationship between operating pressure and leakage rates where reducing excess pressure directly decreases leak flow rates, prolongs time before background leaks develop into detectable leaks or burst pipes, reduces frequency of new pipe bursts and service connection failures, and extends infrastructure service life through reduced mechanical stress. Research and practical experience demonstrate that leak flow rates typically vary with approximately square root of pressure (flow proportional to pressure raised to power 0.5-1.0 depending on leak characteristics), meaning 50% pressure reduction can achieve 30-40% reduction in leakage flow from existing leaks, while also reducing leak frequency substantially.
Pressure management implementation typically proceeds through Pressure Management Areas often coinciding with District Metered Areas, where Pressure Reducing Valves installed at DMA entry points maintain downstream pressure at levels sufficient for customer service while eliminating excessive pressure that exacerbates leakage and infrastructure stress. Fixed outlet pressure PRVs maintain constant downstream pressure regardless of upstream variations, suitable for systems with relatively uniform demand patterns and elevation profiles. Time-modulated PRVs adjust outlet pressure based on time of day, maintaining higher pressure during peak demand periods ensuring adequate supply to all customers, while reducing pressure during low-demand periods (particularly overnight) when customer requirements decrease and pressure reduction achieves maximum leakage benefit without service compromise.
Pressure Management Implementation Strategy:
Assessment and Planning:
• Network pressure survey and mapping
• Critical point identification requiring minimum pressure
• Pressure zone definition and optimization
• Hydraulic modeling for scenario analysis
• PRV location selection and sizing
• Customer service level verification
• Cost-benefit analysis and prioritization
PRV Types and Applications:
• Fixed outlet pressure: Simple, reliable, lower cost
• Time-modulated: Adjusts with demand patterns
• Flow-modulated: Responds to demand variations
• Advanced control systems: Optimized real-time adjustment
• Backup and redundancy provisions
• Remote monitoring and control capability
• Maintenance accessibility and serviceability
Implementation Process:
• PRV installation at strategic points
• Control system integration and commissioning
• Pressure monitoring point establishment
• Baseline measurement before optimization
• Gradual pressure reduction with monitoring
• Customer complaint response protocol
• Performance verification and optimization
Performance Monitoring:
• Continuous pressure and flow data
• Leakage reduction quantification
• Burst frequency tracking
• Customer service level verification
• PRV performance and maintenance
• Economic benefit calculation
• Ongoing optimization adjustments
Advanced Pressure Control:
• Critical point monitoring systems
• Demand-based pressure optimization
• Predictive control algorithms
• Integration with SCADA systems
• Multi-zone coordinated control
• Energy consumption optimization
• Asset management system integration
Advanced pressure management systems employ flow-modulated or remote-controlled PRVs responding dynamically to actual demand patterns, maintaining minimum required pressure at critical points while optimizing pressure reduction elsewhere in system. These intelligent systems use real-time pressure monitoring at critical high-elevation or distant points, automatically adjusting PRV settings ensuring adequate supply during demand fluctuations while maximizing leakage reduction during stable or low-demand periods. Integration with SCADA systems enables centralized monitoring and control across multiple pressure zones, coordinating operation for system-wide optimization while maintaining appropriate pressures for reliable service throughout network under all operating conditions.
Economic analysis of pressure management interventions typically demonstrates strong financial returns with payback periods of 1-3 years in systems with moderate to high leakage levels. Benefits include direct water savings from reduced leakage valued at marginal production cost, reduced burst frequency and repair costs averaging 30-50% in well-managed programs, deferred capital investment in production and treatment capacity expansion, energy savings from reduced pumping requirements both from lower volumes and lower pressures, and extended infrastructure service life through reduced mechanical stress. Case studies from diverse contexts document pressure management achieving 20-40% real loss reduction in systems with initial high pressure and leakage levels, making it priority intervention for many utilities facing NRW challenges.
Success Stories: Phnom Penh, Manila, and Singapore
Phnom Penh Water Supply Authority transformation represents one of water sector's most remarkable success stories, demonstrating that even utilities facing extreme challenges can achieve world-class performance through sustained commitment, strong leadership, systematic approaches, and political support. In 1993, following Cambodia's civil war period, PPWSA existed in dysfunctional state with NRW at 72%, only 10% of customers having water meters with almost none paying bills, daily illegal connection of one per employee, massive corruption and theft, bankruptcy threatening closure, and water supply available only few hours daily to limited service area. Under new director appointed in 1993 with mandate for complete transformation, utility implemented comprehensive reform program addressing all aspects of operation simultaneously.3
PPWSA's transformation strategy combined multiple elements implemented systematically over 15-year period. Infrastructure rehabilitation with international donor support including Asian Development Bank, World Bank, French and Japanese government assistance enabled replacement of deteriorated pipelines, construction of new 16-kilometer transmission line, and treatment plant improvements. Universal metering program installed meters on all connections with regular replacement ensuring accuracy, while strong enforcement eliminated illegal connections offering rewards for reporting violations and penalties for perpetrators. Organizational restructuring established professional management, competitive salaries attracting qualified staff, merit-based promotion systems, and 24-hour standby maintenance teams ensuring rapid leak response. Financial discipline implemented commercial principles including cost recovery tariffs, efficient billing and collection systems, and transparent accounting building financial sustainability.
Phnom Penh Water Supply Authority: Transformation Metrics
Non-Revenue Water Reduction:
• 1993 baseline: 72% NRW (massive losses and theft)
• 2000: 40% NRW (significant improvement through initial reforms)
• 2005: 14% NRW (approaching international best practice)
• 2008: 6.2% NRW (world-class performance achievement)
• Sustained performance: Maintained below 10% subsequently
Service Coverage and Reliability:
• Service area: Expanded from limited core to full city coverage
• Population served: Increased from 220,000 (1993) to 1,000,000+ (2008)
• Water availability: 24 hours/day seven days/week (from few hours daily)
• Connections: Grew from 26,000 to 150,000+ with all metered
• Service reliability: Zero interruptions except emergency maintenance
Financial Performance:
• 1993: Bankrupt with negative revenues unable to cover costs
• 2000: Break-even achievement through improved collections
• 2005: Strong financial position with investment capacity
• Bill collection: Improved from near zero to 99%+
• Self-financing: Able to fund expansion without external subsidies
Operational Excellence:
• Water quality: Meets WHO standards, drinkable from tap
• Customer satisfaction: Consistently above 90%
• Staff productivity: Among highest in region
• Metering accuracy: Universal coverage with regular replacement
• International recognition: Multiple awards and study destination
Results of PPWSA transformation proved spectacular with NRW declining from 72% in 1993 to 6.2% by 2008, subsequently maintained below 10%, representing one of lowest rates globally including comparison with many developed country utilities. Service coverage expanded from limited core area serving 220,000 people to full city coverage reaching over 1 million population with 24-hour supply reliability. Financial transformation moved utility from bankruptcy to strong self-sustaining operation with 99%+ bill collection efficiency, ability to finance expansion from own revenues, and among highest customer satisfaction ratings in Southeast Asia. International water sector recognizes PPWSA as outstanding success story, with utility hosting thousands of visitors annually from utilities worldwide seeking to understand and replicate transformation approach and sustain improvements over extended period.
Manila East Zone concession operated by Manila Water Company provides another Asian success story demonstrating private sector participation potential for NRW reduction and service improvement. When concession commenced in 1997, service area faced 63% NRW, intermittent supply, inadequate coverage, and poor service quality. Company implemented systematic NRW reduction program combining infrastructure investment, DMA establishment covering entire network, aggressive leak detection and repair, pressure management, commercial loss reduction through improved metering and anti-theft measures, and operational efficiency improvements. Results included NRW reduction to 16.9% by 2009 and further to below 12% by 2020, 24-hour supply achievement across service area, coverage expansion to underserved communities, and financial sustainability enabling ongoing investment. Manila example demonstrates private sector capabilities while highlighting importance of appropriate regulatory frameworks, risk allocation, and performance incentives in concession design.10
Singapore represents sustained excellence in water management including world-leading NRW performance maintained at approximately 4.7% through continuous investment, innovation, and improvement rather than one-time transformation. Singapore's success builds on strong governance, adequate financial resources, technical expertise, comprehensive asset management systems, continuous infrastructure investment and replacement, advanced monitoring and control technologies, strong enforcement against illegal connections and theft, and unwavering political commitment to water security given city-state's limited natural water resources. While Singapore's economic development and resource availability differ from many developing countries, principles underlying performance including systematic approaches, long-term investment, professional management, and continuous improvement remain universally applicable and achievable with appropriate adaptation to local contexts and constraints.
Commercial Loss Reduction Strategies
Apparent losses, also termed commercial losses, represent water consumed but not properly measured or billed, generating no revenue despite reaching customers and comprising significant NRW component particularly in developing countries where World Bank estimates suggest they account for approximately 40% of total NRW, often exceeding physical losses in some urban areas. Commercial losses arise from unauthorized consumption through illegal connections and theft, customer meter inaccuracies where aging or incorrectly sized meters under-register actual consumption, systematic data handling errors in billing systems including incorrect customer categories or tariff applications, and billing collection inefficiencies where bills issued but payments not collected. Addressing these losses requires fundamentally different approaches than physical leak reduction, focusing on metering technology, billing systems, enforcement capabilities, and institutional strengthening rather than infrastructure rehabilitation.7
Customer metering accuracy directly affects revenue collection, with under-registering meters failing to capture full consumption volume. Meter accuracy degradation typically occurs over time through mechanical wear, scale accumulation in hard water areas, selection of incorrect meter size for actual flow ranges where meter operates outside optimal range, and installation issues affecting flow profiles entering meter. Progressive utilities implement systematic meter testing and replacement programs targeting high-consumption customers first where potential revenue recovery justifies intervention costs, replacing meters after 8-12 years depending on meter type and water quality, and right-sizing meters during replacement ensuring optimal accuracy for actual consumption patterns. Advanced metering infrastructure with automated meter reading eliminates manual reading errors, provides granular consumption data enabling leak detection on customer side, and supports time-of-use tariffs encouraging efficient water use.
Commercial Loss Reduction Framework:
Metering Improvement:
• Systematic meter testing program
• Replacement prioritization by revenue potential
• Meter sizing verification and optimization
• Advanced metering infrastructure deployment
• Automated meter reading implementation
• Bulk meter accuracy verification
• Quality assurance for new installations
Unauthorized Consumption Control:
• Illegal connection survey and detection
• Enforcement protocols and penalties
• Public reporting reward systems
• Connection regularization programs
• Social tariffs for affordability
• Community engagement and education
• Regular follow-up inspections
Billing System Improvements:
• Customer database accuracy verification
• Consumption anomaly detection systems
• Tariff category verification
• Estimated billing minimization
• Billing cycle optimization
• Data handling error reduction
• Integration with GIS and asset management
Revenue Collection:
• Bill distribution efficiency
• Multiple payment channel provision
• Payment reminder systems
• Disconnection policy enforcement
• Payment plan arrangements
• Collection agency utilization
• Write-off policy clarity
Institutional Strengthening:
• Commercial department capacity building
• Customer service improvement
• Staff integrity and accountability
• Performance monitoring systems
• Regular commercial audits
• Best practice documentation
• Continuous improvement culture
Unauthorized consumption through illegal connections and bypass arrangements constitutes major commercial loss source in many developing country contexts, driven by combination of poverty and inability to afford regular tariffs, weak enforcement enabling violations without consequences, corruption facilitating connection without payment, and social acceptability where community norms tolerate or support illegal access. Addressing unauthorized consumption requires balanced approach combining enforcement with affordability programs. Systematic detection programs identify illegal connections through field surveys, consumption anomaly analysis comparing billing data with expected patterns, DMA water balance analysis revealing unexplained consumption, and community informant systems with appropriate incentives. Enforcement combines penalties for violations, disconnection of illegal connections, and legal consequences for serious cases, while connection regularization programs offer affordable legal connection options with social tariffs, payment plans for accumulated arrears, and community engagement explaining consequences of unauthorized use for system sustainability and service reliability.
Billing system accuracy proves critical for commercial performance, with systematic errors in customer data, consumption recording, tariff application, or billing generation directly reducing revenue. Database verification programs ensure all connections properly registered with correct customer information, property characteristics, and tariff categories, while field surveys identify unregistered connections or incorrect classifications. Consumption anomaly detection systems flag unusual patterns suggesting meter problems, billing errors, or unauthorized use including zero or very low consumption despite connection, sudden significant increases or decreases, patterns inconsistent with customer type, and differences from neighboring similar customers. Addressing identified issues through field verification, meter testing or replacement, billing correction, and database updates gradually improves billing accuracy and revenue collection over time.
Technology and Digitalization Trends
Digital transformation revolutionizes water infrastructure management including NRW reduction, with smart water management market projected to grow from USD 23.7 billion in 2025 to USD 43.7 billion by 2030 at compound annual growth rate of 13%, driven by integration of Internet of Things sensors, cloud computing platforms, artificial intelligence analytics, and automated control systems addressing water scarcity, aging infrastructure, and operational efficiency challenges.4 Countries in Asia-Pacific including India and China increasingly adopt smart water technologies to combat high NRW levels often exceeding 30%, while European regulatory frameworks push utilities toward digital transformation improving efficiency and sustainability. These technology solutions complement and enhance traditional NRW reduction approaches, enabling more precise monitoring, faster response, predictive intervention, and optimization at scales previously unachievable.
Internet of Things sensors deployed throughout distribution networks provide continuous monitoring of flow, pressure, water quality, and equipment status, transmitting data wirelessly to cloud-based platforms for storage, analysis, and visualization. Flow meters at DMA entry points, pressure sensors at critical nodes, acoustic sensors detecting leaks, water quality monitors tracking chlorine and turbidity, and equipment status sensors on pumps and valves create comprehensive network visibility enabling informed decision-making. Cloud platforms aggregate data from thousands of sensors, providing scalable storage, processing power for advanced analytics, remote access for multiple stakeholders, and integration with other enterprise systems including billing, asset management, and customer service. This infrastructure enables shift from periodic manual data collection to continuous automated monitoring, dramatically improving data quality, timeliness, and completeness supporting more effective management.
Digital Technology Applications for NRW Management:
Smart Sensors and Monitoring:
• IoT flow meters for continuous monitoring
• Pressure sensors at critical points
• Acoustic sensors for leak detection
• Water quality monitoring (chlorine, turbidity)
• Equipment status sensors (pumps, valves)
• Wireless communication networks
• Battery life and maintenance optimization
Data Platforms and Integration:
• Cloud-based data storage and processing
• Real-time SCADA integration
• GIS integration for spatial analysis
• Asset management system connectivity
• Billing system data exchange
• Mobile applications for field operations
• Dashboard and visualization tools
Artificial Intelligence Applications:
• Leak detection and localization algorithms
• Predictive maintenance models
• Demand forecasting and optimization
• Pressure optimization algorithms
• Anomaly detection and alerting
• Network hydraulic model calibration
• Energy consumption optimization
Advanced Metering Infrastructure:
• Smart meters with remote reading
• Two-way communication capability
• Hourly or sub-hourly interval data
• Tamper detection and alerts
• Customer leak detection and notification
• Time-of-use tariff support
• Water efficiency program enablement
Automated Control Systems:
• Dynamic pressure control
• Pump optimization and scheduling
• Tank level management
• Water quality parameter control
• Emergency response automation
• Energy cost minimization
• Coordinated multi-zone operation
Artificial intelligence and machine learning applications analyze vast sensor data streams identifying patterns, predicting failures, and optimizing operations beyond human capacity. Leak detection algorithms process acoustic sensor data, flow patterns, and pressure variations identifying leak signatures and locations with increasing accuracy as models train on larger datasets. Recent research reports AI-based leak detection achieving 98.1% accuracy, substantially exceeding traditional methods including Random Forest (97.3%) and Support Vector Machine (93.8%), with root mean square energy and spectral entropy proving particularly diagnostic characteristics. Predictive maintenance models analyze equipment performance trends, operating conditions, and failure histories predicting component failures before occurrence, enabling planned interventions avoiding emergency repairs, reduced downtime, and optimized maintenance resource allocation. Demand forecasting and pressure optimization algorithms continuously adjust system operation matching supply with predicted demand while minimizing pressure and energy consumption.
Advanced Metering Infrastructure provides granular consumption data supporting both utility operations and customer engagement. AMI enables automated meter reading eliminating manual reading costs and errors, hourly or sub-hourly interval data revealing consumption patterns supporting leak detection and demand management, remote disconnection and reconnection reducing operational costs, tamper detection and alerts preventing revenue loss, and customer portals with consumption information encouraging conservation. AMI data combined with network monitoring enables rapid identification of leaks on customer side through continuous flow indicating fixture leaks or running toilets, with automated customer notification enabling early correction before substantial water and cost accumulation. Time-of-use tariffs supported by AMI encourage consumption shifting to off-peak periods, reducing peak demands and enabling infrastructure optimization.
Detailed Implementation Phase Framework
Successful NRW reduction requires systematic implementation following structured phases from initial assessment through sustained operations, with each phase building on previous accomplishments while addressing specific technical, organizational, and financial requirements. This section provides detailed implementation framework including decision trees, process flows, and assessment algorithms guiding utilities through complex transformation journey. Framework proves adaptable to diverse utility contexts, scalable to available resources, and flexible enough to accommodate local conditions while maintaining focus on core principles ensuring lasting reduction rather than temporary improvements.
NRW REDUCTION IMPLEMENTATION ROADMAP
PHASE 1: BASELINE ASSESSMENT & PLANNING (Months 1-6)
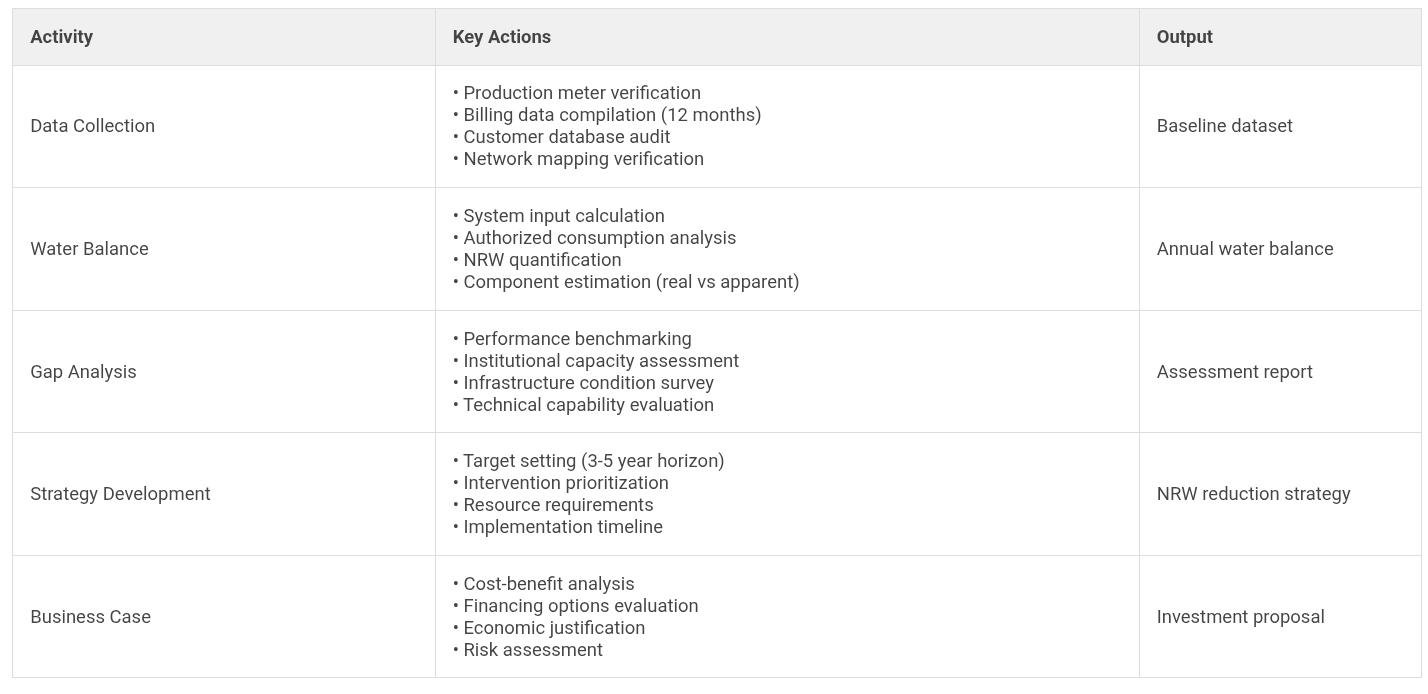
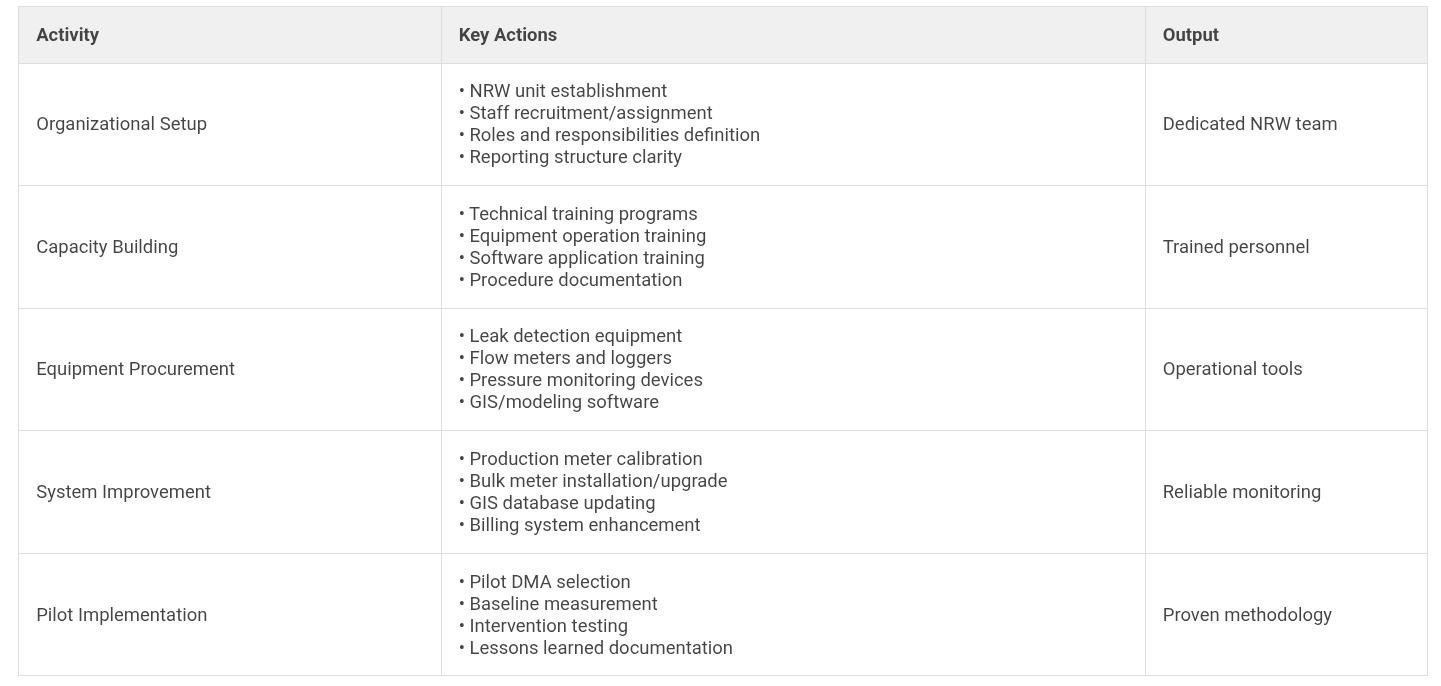
PHASE 2: FOUNDATION ESTABLISHMENT (Months 6-12)
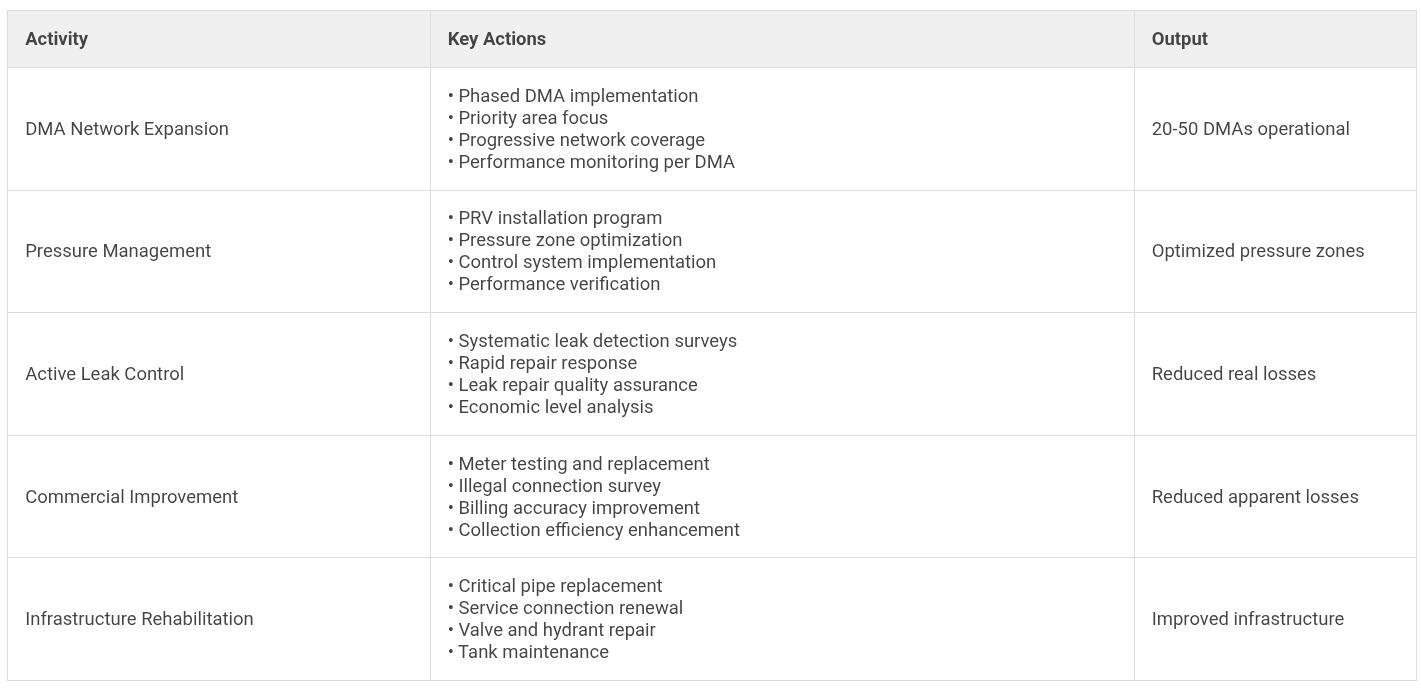
PHASE 3: SYSTEMATIC ROLLOUT (Months 12-36)
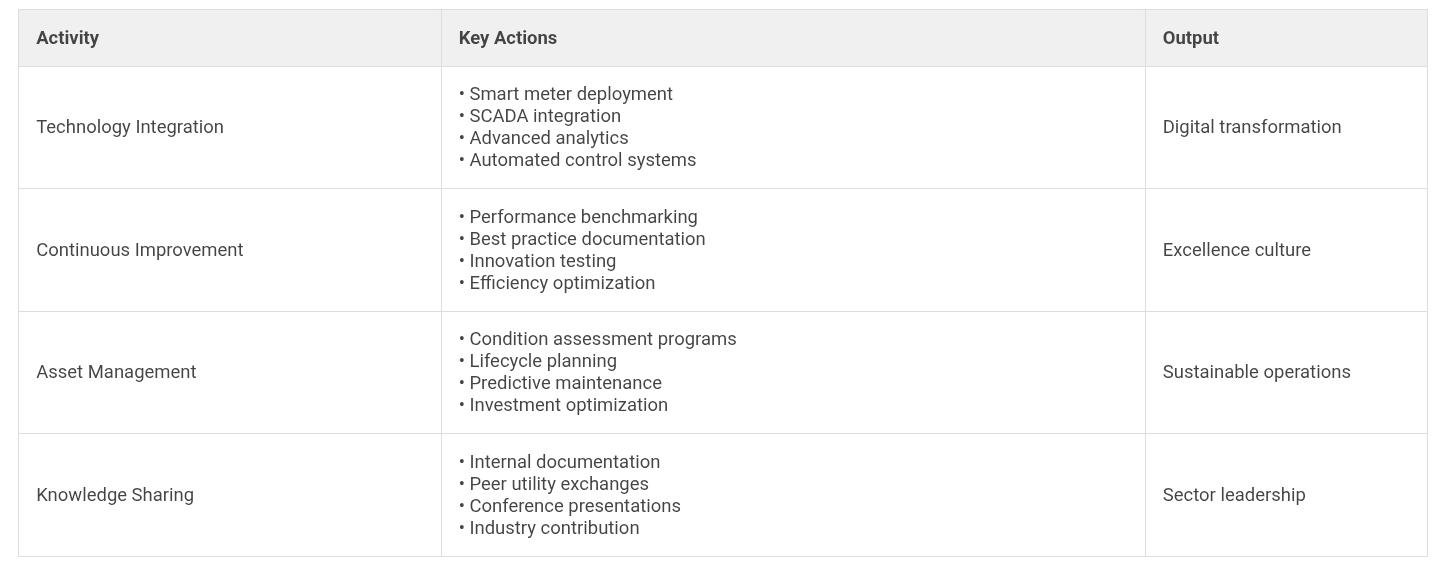
PHASE 4: OPTIMIZATION & SUSTAINABILITY (Months 36+)
NRW Assessment and Prioritization Algorithm
DECISION TREE: NRW INTERVENTION PRIORITIZATION
START: Calculate Complete Water Balance
↓
QUESTION 1: What is your NRW %?
NRW = (System Input - Billed Authorized Consumption) / System Input × 100
|
IF: NRW < 20% → EXCELLENT performance |
IF: NRW 20-35% → MODERATE losses |
IF: NRW > 35% → HIGH losses - urgent action |
↓
QUESTION 2: What dominates - Real or Apparent Losses?
Real Losses % = Real Losses / System Input × 100
Apparent Losses % = Apparent Losses / System Input × 100
|
IF: Real Losses > Apparent Losses PRIORITY INTERVENTIONS: 1. Pressure management (highest ROI) |
IF: Apparent Losses > Real Losses PRIORITY INTERVENTIONS: 1. Customer meter replacement program |
↓
QUESTION 3: What are your resource constraints?
|
SEVERE Constraints START WITH: • 2-3 pilot DMAs |
MODERATE Resources IMPLEMENT: • 10-20 DMA rollout |
ADEQUATE Resources FULL PROGRAM: • Complete DMA coverage |
↓
RESULT: Customized Implementation Strategy
Based on: NRW level + Loss composition + Resource availability
Leading to: Optimal intervention mix + Realistic timeline + Sustainable program
DMA Design and Implementation Process Flowchart
DISTRICT METERED AREA IMPLEMENTATION WORKFLOW
STEP 1: NETWORK ANALYSIS AND DMA BOUNDARY DESIGN
→ GIS database verification and updating
→ Network topology analysis
→ Elevation profile mapping
→ Existing valve location identification
→ Customer density analysis
→ Hydraulic modeling preparation
Tools Required: GIS software, hydraulic modeling software, topographic maps, network data
Duration: 2-4 weeks per DMA design
STEP 2: DMA SIZING AND BOUNDARY OPTIMIZATION
→ Target size: 500-3,000 connections per DMA
→ Minimize boundary valves required
→ Consider natural boundaries (roads, railways)
→ Uniform elevation within DMA preferred
→ Single pressure zone per DMA ideal
→ Future expansion provisions
Decision Criteria: Balance between granularity and management complexity
Output: Proposed DMA boundaries and entry/exit points
STEP 3: HYDRAULIC VERIFICATION AND MODELING
→ Model proposed DMA configuration
→ Verify pressure adequacy all nodes
→ Check fire flow requirements
→ Assess peak demand scenarios
→ Evaluate emergency supply redundancy
→ Optimize entry point locations
Criteria: Minimum pressure 15-20m, maximum pressure 60-80m, adequate fire flows
Iteration: Adjust boundaries if hydraulic criteria not met
STEP 4: PHYSICAL IMPLEMENTATION
→ Boundary valve installation/closure
→ Flow meter procurement and installation
→ Data logger and telemetry setup
→ Pressure monitoring points installation
→ GIS database update with as-built
→ System commissioning and testing
Components: Electromagnetic flow meters, pressure loggers, communication system
Duration: 2-4 weeks per DMA implementation
STEP 5: BASELINE MEASUREMENT AND MONITORING
→ Continuous flow monitoring (15-min intervals)
→ Pressure monitoring at key points
→ Minimum Night Flow (MNF) identification
→ Night consumption estimation
→ Leakage calculation by subtraction
→ Baseline water balance for DMA
Duration: Minimum 2-4 weeks baseline data collection
Output: DMA performance baseline and leakage estimate
STEP 6: LEAK DETECTION AND INTERVENTION
→ Prioritize high-leakage DMAs
→ Acoustic leak detection survey
→ Leak localization and excavation
→ Repair execution with quality assurance
→ Post-repair MNF verification
→ Water savings quantification
Frequency: Annual surveys for high-loss DMAs, biennial for moderate
Target: Economic Level of Leakage based on cost-benefit
STEP 7: ONGOING MANAGEMENT AND OPTIMIZATION
→ Monthly DMA performance reporting
→ Automated alert systems for flow anomalies
→ Regular pressure optimization
→ Preventive maintenance program
→ Performance benchmarking across DMAs
→ Continuous improvement initiatives
Sustainability: Integrate into routine operations, not special project
Evolution: Expand coverage, refine methodologies, adopt innovations
Pressure Management Implementation Algorithm
PRESSURE MANAGEMENT DECISION AND IMPLEMENTATION FRAMEWORK
| Assessment Phase | Key Questions | Decision Path |
|---|---|---|
| 1. Pressure Survey Measure existing pressures throughout network |
• What is average system pressure? • What is maximum pressure in system? • Where do pressure extremes occur? • What is pressure variation over 24 hours? |
IF Average > 60m: High potential for pressure management IF Average 40-60m: Moderate potential IF Average < 40m: Limited scope without system changes |
| 2. Critical Point Analysis Identify minimum pressure requirements |
• Where are highest elevation points? • What are end-of-line locations? • What is minimum acceptable pressure? • Are there special users (hospitals)? |
Establish: Minimum 15-20m residual at critical points Action: Install permanent monitors at critical points Target: Maintain minimum, reduce excess elsewhere |
| 3. Zone Definition Create pressure management areas |
• Can system be divided into zones? • Do zones align with DMAs? • Are separate feed mains available? • What are elevation differences? |
Ideal: Pressure zones = DMAs for integrated management Alternative: Multiple DMAs per pressure zone Priority: High-pressure zones first |
| 4. PRV Strategy Select appropriate valve type and control |
• What are demand variations? • Is remote monitoring feasible? • What budget is available? • What technical capacity exists? |
Basic: Fixed outlet PRVs (lowest cost) Intermediate: Time-modulated PRVs Advanced: Flow-modulated or remote-controlled PRVs |
PRESSURE MANAGEMENT IMPLEMENTATION SEQUENCE
PHASE A: Initial Reduction (Weeks 1-2)
• Install PRV at zone entry point
• Set initial outlet pressure: Current Average - 10m
• Monitor critical point pressures closely
• Respond immediately to any complaints
• Verify no service level impacts
PHASE B: Progressive Reduction (Weeks 3-6)
• Reduce pressure further by 5m increments
• Wait 1 week between reductions
• Continue critical point monitoring
• Track customer complaints (should remain low)
• Stop at minimum acceptable level (typically 15-20m at critical point)
PHASE C: Flow and Leakage Verification (Weeks 7-10)
• Compare DMA flows before and after
• Calculate MNF reduction achieved
• Verify customer consumption unchanged
• Quantify leakage reduction
• Document water and cost savings
PHASE D: Optimization and Expansion (Ongoing)
• Implement time modulation if appropriate
• Expand to additional pressure zones
• Integrate with SCADA for remote control
• Regular PRV maintenance program
• Continuous performance monitoring
EXPECTED OUTCOMES FROM PRESSURE MANAGEMENT:
| Real loss reduction: | 20-40% in high-pressure systems |
| Burst frequency reduction: | 30-50% typical achievement |
| Infrastructure life extension: | 15-25% increase in asset life |
| Typical payback period: | 1-3 years based on water savings |
| Energy savings: | 5-15% reduction in pumping costs |
Commercial Loss Reduction Process Framework
APPARENT LOSS REDUCTION SYSTEMATIC APPROACH
METER ACCURACY PROGRAM
Step 1: Meter Testing Campaign
→ Random sample testing (100-200 meters)
→ Statistical analysis of accuracy
→ Identify meter types/ages with issues
→ Estimate total under-registration
Step 2: Prioritization Analysis
→ Rank customers by consumption
→ Calculate potential revenue recovery
→ Prioritize high-consumption customers
→ Develop replacement schedule
Step 3: Systematic Replacement
→ Replace meters > 10 years old
→ Right-size during replacement
→ Quality assurance testing
→ Track consumption changes
Expected Impact:
Revenue increase: 3-8% typical for aged meters
Payback: 3-5 years for high-volume customers
ILLEGAL CONNECTION CONTROL
Step 1: Detection Methods
→ DMA water balance anomalies
→ Field surveys by trained teams
→ Community informant systems
→ Aerial/satellite imagery analysis
Step 2: Enforcement Strategy
→ Warning letters first offense
→ Disconnection second offense
→ Legal action for serious cases
→ Publicize enforcement actions
Step 3: Regularization Program
→ Affordable connection options
→ Social tariffs for low-income
→ Payment plans for arrears
→ Community engagement
Expected Impact:
Revenue increase: 5-15% in high-theft areas
Requires: Strong political support
BILLING SYSTEM IMPROVEMENT WORKFLOW
| Issue Category | Detection Method | Corrective Action |
| Unregistered Connections | Field surveys vs database DMA consumption analysis |
Add to billing database Backbill where appropriate Verify all connections accounted |
| Incorrect Tariff Category | Customer type verification Consumption pattern analysis |
Correct classification Adjust tariff prospectively May backbill if error recent |
| Estimated Billing | Billing records review Meter reading success rate |
Improve meter accessibility Handheld devices for readers AMI consideration long-term |
| Zero/Low Consumption | Automated flagging system Statistical analysis |
Field investigation Meter testing/replacement Check for bypass or theft |
| Data Entry Errors | Quality control checks Reasonableness validation |
Automated validation rules Staff training programs Error correction protocols |
Financing and Business Models for NRW Programs
Financing NRW reduction programs requires addressing apparent paradox where utilities most needing intervention often lack financial resources for implementation, while substantial investments generate returns through water savings, revenue recovery, and operational efficiency improvements that strengthen financial position enabling further investment. Traditional utility capital budgets prioritize visible infrastructure like treatment plants or major pipelines over less visible NRW interventions, though economic analysis typically demonstrates NRW reduction providing superior returns on investment with payback periods of 2-5 years in systems with moderate to high losses. Overcoming financing constraints requires creative approaches combining internal resources, commercial financing, development assistance, performance-based contracts, and innovative business models aligning incentives with outcomes.
Internal utility financing from operational revenues proves most sustainable long-term approach, requiring adequate tariffs enabling cost recovery and investment, improved collection efficiency reducing accounts receivable, operational efficiency improvements freeing resources for capital investment, and prioritization recognizing NRW reduction as foundational investment enabling service expansion and quality improvement. Progressive utilities allocate 5-10% of annual capital budgets to NRW programs, treating leak reduction as ongoing operational requirement rather than one-time project, and reinvesting savings from reduced water losses and operating costs into expanded programs creating virtuous cycle of improvement. However, utilities facing severe financial constraints may lack resources for even modest investments, requiring external support or alternative financing mechanisms to initiate programs generating subsequent savings enabling self-sustained continuation.
Financing Options and Business Models:
Utility Internal Financing:
• Operational budget allocation (5-10% capital budget)
• Revenue improvement reinvestment
• Operational efficiency savings allocation
• Depreciation fund utilization
• Reserve fund establishment
• Performance incentive retention
• Long-term commitment and sustainability
Commercial Financing:
• Commercial bank loans for utilities
• Municipal bonds and debt instruments
• Equipment supplier financing
• Leasing arrangements for equipment
• Green bonds for sustainable infrastructure
• Infrastructure funds and investors
• Credit enhancement facilities
Development Assistance:
• Multilateral development bank loans (World Bank, ADB)
• Bilateral development agency grants
• Technical assistance and capacity building
• Blended finance combining grants and loans
• Results-based financing approaches
• Innovative financing mechanisms
• South-South cooperation programs
Performance-Based Contracts:
• Specialist NRW companies under fixed-price contracts
• Payment linked to measured water savings
• Risk sharing between utility and contractor
• Transfer of technical expertise
• Capacity building component
• Sustainability provisions post-contract
• Transparent performance monitoring
Public-Private Partnerships:
• Management contracts with performance targets
• Lease arrangements with investment obligations
• Concessions with long-term service commitments
• Joint ventures combining public and private resources
• Design-build-operate arrangements
• Risk and reward sharing mechanisms
• Regulatory oversight and consumer protection
Performance-based contracts with specialist NRW reduction companies provide alternative where utilities lack internal technical capacity or resources for comprehensive programs. These arrangements typically involve fixed-price contracts or payment linked to measured water savings, transferring implementation risk and performance obligations to specialist contractors with demonstrated expertise, equipment, and methodologies. Contractors implement complete programs including leak detection, repair, meter replacement, pressure management, and apparent loss reduction, with payments structured to align incentives with results, such as sharing water savings value or fixed payments upon achieving specified NRW reduction targets. World Bank analysis of performance-based NRW contracts indicates mixed results, with successes in cases with clear objectives, appropriate risk allocation, adequate utility cooperation, and sustained post-contract commitment, but failures where contracts poorly designed, utility support lacking, or sustainability provisions inadequate.11
Development finance institutions including World Bank, Asian Development Bank, African Development Bank, and bilateral development agencies provide substantial support for NRW reduction through loans, grants, technical assistance, and innovative financing mechanisms. These institutions recognize NRW reduction as high-impact intervention addressing water security, utility sustainability, and service expansion to unserved populations, while offering attractive economic returns justifying investment. Technical assistance grants support capacity building, institutional strengthening, and program design preparing utilities for successful implementation, while concessional loans or blended finance combining grants with commercial financing improve affordability for resource-constrained utilities. Results-based financing approaches link disbursements to achievement of specified performance targets, incentivizing effective implementation and demonstrating results orientation appealing to development partners and recipient utilities.
Institutional and Governance Requirements
Technical interventions alone prove insufficient for sustained NRW reduction, with institutional capacity, governance quality, organizational culture, and political support critically important determining success or failure. Phnom Penh, Manila, and Singapore success stories share common institutional elements including strong utility leadership with vision and authority implementing comprehensive reforms, political support protecting utilities from interference and providing necessary resources, professional management applying commercial principles despite public ownership, merit-based staff recruitment and promotion building capable workforce, accountability for performance with consequences for results, continuous improvement culture rather than accepting status quo, and customer service orientation recognizing consumers as stakeholders deserving quality service. Utilities lacking these institutional foundations struggle achieving lasting improvement regardless of technical intervention quality or financial resource availability.
Organizational structure influences NRW management effectiveness, with dedicated commercial and technical teams focused specifically on loss reduction, clear responsibilities and authority for different NRW components, coordination mechanisms ensuring integrated approaches, performance monitoring systems tracking indicators and progress, and management support prioritizing NRW reduction recognizing business case. Utilities treating NRW reduction as additional responsibility for already-stretched operational staff rather than priority requiring dedicated resources typically achieve limited results, while those establishing specialized departments with appropriate staffing, equipment, training, and management attention demonstrate superior performance. Successful organizational models vary from separate NRW divisions with technical and commercial sections, to integrated asset management departments incorporating NRW within broader infrastructure optimization, to specialized public-private entities combining utility knowledge with commercial efficiency.
Institutional Strengthening Framework:
Leadership and Vision:
• Executive commitment to NRW reduction
• Clear strategic objectives and targets
• Resource allocation authority
• Performance accountability culture
• Change management capability
• Long-term sustainability focus
• Stakeholder engagement and communication
Organizational Capacity:
• Dedicated NRW management unit
• Appropriate staffing and skills
• Technical equipment and tools
• Standard operating procedures
• Training and development programs
• Knowledge management systems
• Continuous improvement processes
Performance Management:
• Clear performance indicators and targets
• Regular monitoring and reporting
• Benchmarking with peer utilities
• Incentive systems linked to results
• Corrective action protocols
• Transparent public reporting
• External verification and audits
Governance and Accountability:
• Clear mandate and authority
• Autonomy in operational decisions
• Board oversight and guidance
• Regulatory framework alignment
• Customer feedback mechanisms
• Anti-corruption measures
• Political support and protection
Stakeholder Engagement:
• Customer education and awareness
• Community participation programs
• Government coordination mechanisms
• Private sector partnerships
• Civil society collaboration
• Media relations and communication
• Transparency and accountability
Workforce capacity building proves essential for sustained performance, requiring initial training in NRW concepts, measurement methodologies, technical interventions, and commercial practices, followed by ongoing skill development as technologies and approaches evolve. Many utilities face challenges recruiting and retaining qualified technical staff due to uncompetitive compensation, limited career advancement opportunities, or unattractive working conditions, with staff turnover undermining institutional knowledge accumulation and program continuity. Progressive utilities address these challenges through competitive compensation packages attracting qualified candidates, merit-based promotion systems providing career advancement, structured training programs developing capabilities, and positive organizational culture creating satisfying work environment. International exchanges, study tours, and twinning arrangements with high-performing utilities provide valuable learning opportunities exposing staff to best practices and building networks for ongoing knowledge sharing.
Political support and regulatory frameworks create enabling environment for utility performance or impose constraints hindering improvement. Utilities operating within supportive political frameworks benefit from adequate autonomy for operational decisions without interference, resources enabling infrastructure investment and program implementation, protection from unrealistic demands or corruption pressures, recognition and rewards for performance improvement, and regulatory frameworks with clear performance standards and accountability. Conversely, utilities facing political interference in management appointments or operational decisions, inadequate tariffs preventing cost recovery due to political pressure, corruption diverting resources or enabling theft, or regulatory frameworks with perverse incentives discouraging efficiency struggle achieving sustainable improvement regardless of technical capabilities. Sector reform addressing these governance issues often proves prerequisite for lasting utility transformation and NRW reduction.
Comprehensive NRW Reduction Implementation Checklist
Phase 1: Assessment and Planning (Months 1-3)
☐ Establish NRW steering committee with executive support
☐ Compile baseline data (production, consumption, billing)
☐ Conduct preliminary water balance calculation
☐ Assess data quality and identify gaps
☐ Review existing infrastructure condition
☐ Evaluate organizational capacity and resources
☐ Benchmark performance against peers
☐ Define clear objectives and targets
☐ Develop business case and financial analysis
☐ Secure management commitment and resources
Phase 2: Infrastructure and Data Foundation (Months 3-9)
☐ Verify and calibrate production meters
☐ Update GIS with network infrastructure
☐ Establish bulk meter monitoring system
☐ Implement customer billing cycle adjustment
☐ Begin customer database verification
☐ Procure leak detection equipment
☐ Train staff in water balance and leak detection
☐ Develop standard operating procedures
☐ Establish performance monitoring system
☐ Create monthly reporting protocols
Phase 3: DMA Implementation (Months 9-18)
☐ Conduct network analysis and DMA design
☐ Prioritize DMAs for initial implementation
☐ Install boundary valves and flow meters
☐ Commission telemetry and data logging
☐ Establish DMA water balance monitoring
☐ Calculate baseline minimum night flows
☐ Identify high-loss DMAs for priority action
☐ Implement systematic leak detection program
☐ Establish rapid repair response system
☐ Document lessons learned and best practices
Phase 4: Pressure Management (Months 12-24)
☐ Conduct system-wide pressure survey
☐ Identify pressure management zones
☐ Design PRV installations and settings
☐ Procure and install pressure reducing valves
☐ Commission PRV control systems
☐ Monitor pressure and leakage response
☐ Optimize PRV settings based on performance
☐ Verify customer service level maintenance
☐ Calculate economic benefits achieved
☐ Plan additional pressure management zones
Phase 5: Commercial Loss Reduction (Months 15-36)
☐ Conduct meter accuracy testing program
☐ Develop meter replacement strategy
☐ Implement systematic meter replacement
☐ Survey for illegal connections
☐ Establish enforcement protocols
☐ Implement connection regularization program
☐ Upgrade billing system capabilities
☐ Improve revenue collection processes
☐ Monitor apparent loss indicators
☐ Verify billing and collection efficiency
Phase 6: Sustainability and Expansion (Ongoing)
☐ Institutionalize NRW as core business function
☐ Establish long-term investment program
☐ Expand DMA coverage to entire network
☐ Implement advanced monitoring technologies
☐ Develop staff capacity continuously
☐ Benchmark performance regularly
☐ Maintain stakeholder communication
☐ Adapt approaches based on lessons learned
☐ Celebrate successes and recognize achievements
☐ Share experiences with sector peers
Frequently Asked Questions
Q1: What is the acceptable level of NRW for a water utility?
No universal standard exists, but international guidance suggests 20-25% as reasonable target for developing countries, 15-20% for middle-income utilities with good management, and 10-15% or lower for developed country utilities. However, percentage figures prove misleading as performance indicators since they vary with consumption levels. Infrastructure Leakage Index comparing actual to minimum achievable losses given system characteristics provides more appropriate performance measure, with ILI below 4 considered acceptable, 4-8 requiring improvement, and above 8 indicating poor performance requiring urgent intervention.
Q2: Should utilities prioritize real losses or apparent losses reduction?
Priority depends on utility's specific situation assessed through water balance analysis. Utilities with high real losses (physical leakage) exceeding 20-25% of system input should prioritize infrastructure improvements, pressure management, and active leak detection generating large water savings. Utilities where apparent losses (commercial losses) represent significant proportion of NRW should focus on metering accuracy, billing systems, and enforcement. Most utilities benefit from integrated approaches addressing both components simultaneously with resource allocation proportional to financial impact calculated through water balance valuation of different loss components.
Q3: How long does it take to reduce NRW significantly?
Timeframes vary substantially based on starting NRW level, available resources, institutional capacity, and commitment intensity. Phnom Penh achieved reduction from 72% to approximately 20% within five years through intensive comprehensive program, reaching 6% by year 15. Typical utilities with moderate starting conditions (30-40% NRW) and systematic approaches achieve 5-10 percentage point reduction within 2-3 years, with continued improvement to 20-25% range over 5-7 years. However, sustainability requires ongoing effort rather than one-time campaign, with leading utilities maintaining continuous programs preventing loss levels from increasing again.
Q4: What is the typical payback period for NRW reduction investments?
Economic analysis typically demonstrates payback periods of 2-5 years for NRW reduction programs in systems with moderate to high losses, varying based on water cost, intervention type, and loss levels. Pressure management interventions often achieve 1-3 year paybacks through water savings and reduced burst frequency. Active leak detection programs typically show 2-4 year returns in high-loss systems. Commercial loss reduction through meter replacement demonstrates 3-5 year paybacks for high-consumption customers. These payback calculations consider direct water savings at marginal production cost plus additional benefits including deferred capacity expansion, reduced operational costs, improved revenue collection, and extended infrastructure life.
Q5: Can NRW reduction programs be self-financing?
Initial NRW reduction programs typically require upfront investment from utility budgets, commercial financing, or development assistance, but once programs generate water savings and revenue improvements, these benefits can fund program continuation and expansion creating self-sustaining cycle. Progressive utilities reinvest NRW reduction savings into expanded programs, allocating portion of water saved or revenue recovered to continuing leak detection, meter replacement, pressure management, and other interventions. This self-financing approach proves most sustainable long-term, though adequate initial investment remains necessary establishing foundations for subsequent self-sustained improvement.
Q6: What role does technology play in NRW reduction?
Technology proves increasingly important enabling more effective, efficient NRW management through sensors providing continuous monitoring, data analytics identifying patterns and anomalies, automated control systems optimizing operations, and advanced metering infrastructure supporting both technical and commercial loss reduction. However, technology represents tool rather than solution itself, requiring appropriate institutional frameworks, skilled workforce, sustainable financing, and management commitment for effective deployment. Many utilities achieve significant NRW reduction using relatively simple traditional approaches of systematic leak detection, meter replacement, and pressure management before investing in advanced technologies, while others successfully leapfrog to smart water management solutions when appropriate institutional and financial foundations exist.
Q7: How can utilities address illegal connections without creating social problems?
Balancing enforcement against social considerations requires nuanced approaches combining several elements: connection regularization programs offering affordable legal connection options with payment plans for accumulated debts, social tariffs providing subsidized rates for low-income households, community engagement explaining how illegal connections undermine system sustainability harming all users, incremental enforcement beginning with warnings and progressing to disconnection only after repeated violations, and partnership with community organizations and local government addressing underlying affordability and access issues. Successful programs recognize illegal connections often stem from poverty rather than criminality, requiring solutions addressing social dimensions alongside technical and commercial aspects.
Q8: What is Infrastructure Leakage Index and why is it better than percentage NRW?
Infrastructure Leakage Index (ILI) compares utility's actual real losses to minimum technically achievable real losses given system characteristics including mains length, number of service connections, average operating pressure, and other factors largely beyond utility control. ILI calculation divides Current Annual Real Losses (CARL) by Unavoidable Annual Real Losses (UARL), yielding dimensionless indicator where ILI of 1.0 represents theoretical best achievable performance, ILI below 4 indicates good performance, ILI 4-8 suggests room for improvement, and ILI above 8 indicates poor performance requiring urgent attention. ILI proves superior to percentage NRW for performance assessment because it accounts for system characteristics affecting leakage potential, enables meaningful comparison between utilities with different network configurations, and remains stable regardless of consumption variations unlike percentage indicators.
Q9: How can small utilities with limited resources implement NRW reduction?
Small utilities face particular challenges with limited financial resources, technical capacity, and economies of scale, but several approaches enable meaningful NRW reduction: phased implementation beginning with highest-impact, lowest-cost interventions, regional cooperation sharing equipment, expertise, and costs among multiple small utilities, development assistance accessing grants or concessional financing from development banks or bilateral agencies, performance-based contracts transferring risk to specialist companies while building local capacity, simplified approaches using appropriate technologies rather than sophisticated expensive systems, focus on low-cost high-impact interventions like pressure management and apparent loss reduction before expensive infrastructure rehabilitation, and twinning arrangements with larger utilities providing mentoring and knowledge transfer. Key success factor involves realistic targets and timeframes matching available resources and capacity rather than overambitious programs exceeding implementation capability.
Essential Terminology Glossary
Non-Revenue Water (NRW): Water produced and input to distribution system but not generating revenue, calculated as System Input Volume minus Billed Authorized Consumption
Real Losses: Physical water lost from pressurized system through leakage in transmission mains, distribution pipes, service connections, and storage facilities
Apparent Losses: Water consumed but not properly measured or billed, including unauthorized consumption, meter inaccuracies, and billing errors (also called commercial losses)
District Metered Area (DMA): Discrete zone of distribution network with defined boundaries and limited entry/exit points equipped with flow meters, enabling precise measurement and management
Minimum Night Flow (MNF): Lowest flow into DMA during early morning hours (typically 2-4 AM) when consumption minimal, primarily representing leakage plus legitimate night consumption
Infrastructure Leakage Index (ILI): Performance indicator comparing actual real losses to minimum achievable losses given system characteristics, calculated as CARL/UARL
Pressure Management: Systematic approach to controlling and reducing excess pressure in distribution networks to minimize leakage and infrastructure stress
Pressure Reducing Valve (PRV): Control valve maintaining downstream pressure at specified level regardless of upstream variations, used for pressure management
System Input Volume: Annual volume of water entering the portion of water supply system to which water balance relates, measured at treatment works output or bulk supply meters
Authorized Consumption: All water legitimately used whether billed or unbilled, including metered and unmetered consumption for all authorized purposes
Water Balance: Systematic accounting of all water volumes in system from input through various consumption and loss components, following IWA standardized methodology
Active Leak Detection: Systematic program using acoustic or other technologies to locate unreported leaks for repair, contrasting with passive approach responding only to visible leaks
Economic Level of Leakage (ELL): Optimal leakage level where marginal cost of further reduction equals marginal benefit from water saved
Advanced Metering Infrastructure (AMI): Integrated system of smart meters, communication networks, and data management enabling automated meter reading and two-way communication
SCADA: Supervisory Control and Data Acquisition system providing real-time monitoring and remote control of distributed water infrastructure
Conclusions and Future Outlook
Non-Revenue Water reduction represents one of water sector's most significant opportunities simultaneously addressing water security, utility financial sustainability, infrastructure efficiency, and service expansion to unserved populations. Global experience demonstrates that substantial NRW reduction proves technically feasible and economically attractive across diverse contexts from developing to developed countries, with success stories from Phnom Penh, Manila, Singapore, and numerous other utilities documenting transformations from high-loss poorly-performing systems to efficient well-managed operations. These successes share common elements of strong leadership and political support, systematic methodologies based on IWA Water Balance framework, comprehensive approaches addressing both technical and commercial losses, sustained commitment over multi-year periods, adequate financing and resources, institutional capacity building, and continuous improvement culture rather than accepting status quo.
Future trends indicate increasing integration of digital technologies, artificial intelligence, and automated systems enabling more sophisticated NRW management. Smart water management market growth from USD 23.7 billion (2025) to USD 43.7 billion (2030) reflects widespread recognition that traditional approaches, while effective, can be enhanced through sensor networks, advanced analytics, and automated control systems providing real-time visibility, predictive capabilities, and optimized operations. However, technology alone cannot solve NRW challenges absent appropriate institutional frameworks, skilled workforce, sustainable financing, and management commitment. Most successful implementations combine traditional proven methodologies with selective technology deployment where benefits justify costs and organizational capacity exists for effective utilization.
Climate change and water scarcity intensify NRW reduction importance as regions facing water stress cannot afford losing 30-50% of produced water through preventable technical and commercial losses. Reducing NRW provides immediate capacity expansion at fraction of cost required for new source development or treatment plant construction, making it priority intervention for water-stressed regions. Additionally, energy savings from reduced pumping and treatment contribute to climate change mitigation, while improved service reliability and coverage enhance climate adaptation by ensuring water security for vulnerable populations. Integration of NRW reduction with broader water resource management, demand management, and climate resilience strategies creates synergies maximizing overall water sector sustainability.
Sector challenges remain significant, with majority of developing country utilities still experiencing NRW levels above 30% and many exceeding 40-50%, representing massive economic losses, wasted resources, and missed opportunities for service expansion. Addressing these challenges requires sustained commitment from governments, development partners, utilities, and civil society, combined with appropriate financing mechanisms, capacity building programs, knowledge sharing, and continuous innovation. However, demonstrated successes prove transformation achievable even in difficult circumstances, providing hope and practical roadmaps for utilities worldwide seeking to improve performance, strengthen financial sustainability, and provide reliable water services to growing populations facing increasing water scarcity and climate uncertainty.
References and Data Sources:
1. Proparco. (2024). Non-Revenue Water is water wasted - is resource wasted.
https://www.proparco.fr/en/article/non-revenue-water-water-wasted-resource-wasted
2. Asian Development Bank. From Loss to Profit: Structural Transformation via Reduced Non-Revenue Water.
https://www.adb.org/news/features/loss-profit-structural-transformation-reduced-non-revenue-water
3. MDPI Water Journal. (2017). Understanding Public Perception of and Participation in Non-Revenue Water Management in Malaysia to Support Urban Water Policy.
https://mdpi.com/2073-4441/9/1/26/htm
4. Globe Newswire. (2025). Smart Water Management Global Markets Report 2024-2025 & 2030.
https://www.globenewswire.com/news-release/2025/08/28/3140552/0/en/Smart-Water-Management-Global-Markets-Report-2024-2025-2030-with-Profiles-of-Leading-Players-Xylem-Siemens-Veolia-Schneider-Electric-and-Honeywell-International.html
5. LEAKSSuite Library. IWA Water Balance - Standard Methodology.
https://www.leakssuitelibrary.com/iwa-water-balance/
6. IWA Water Supply Journal. (2024). Assessment of non-revenue water in the urban water distribution system network in Cameroon (Central Africa).
https://iwaponline.com/ws/article/24/5/1755/101526/Assessment-of-non-revenue-water-in-the-urban-water
7. Wikipedia. (2025). Non-revenue water.
https://en.wikipedia.org/wiki/Non-revenue_water
8. World Bank Blogs. (2024). What is non-revenue water? How can we reduce it for better water service?
https://blogs.worldbank.org/en/water/what-non-revenue-water-how-can-we-reduce-it-better-water-service
9. Applied Water Science. (2022). Division of district metered areas (DMAs) in a part of water supply network using WaterGEMS (Bentley) software: a case study.
https://link.springer.com/article/10.1007/s13201-022-01688-2
10. ResearchGate. (2012). Good Practices in Urban Water Management: Bangkok, Thailand.
https://www.researchgate.net/publication/295073833_Good_Practices_in_Urban_Water_Management_Bangkok_Thailand
11. World Bank. (2006). The Challenge of Reducing Non-Revenue Water (NRW) in Developing Countries.
https://documents1.worldbank.org/curated/en/385761468330326484/pdf/394050Reducing1e0water0WSS81PUBLIC1.pdf
12. Asian Development Bank. (2010). The Issues and Challenges of Reducing Non-Revenue Water.
https://www.adb.org/sites/default/files/publication/27473/reducing-nonrevenue-water.pdf
13. RTI International. (2010). Non-Revenue Water: Financial Model for Optimal Management in Developing Countries.
https://www.rti.org/rti-press-publication/non-revenue-water-financial-model-optimal-management-developing-countries/fulltext.pdf
14. Aqua Analytics. (2025). Using The IWA Water Balance To Understand Your Water Loss.
https://aquaanalytics.com.au/resources/using-the-iwa-water-balance-to-understand-your-water-loss/
15. NIUA. Extent of Non-Revenue Water - Training Manual.
https://niua.in/c-cube/sites/all/themes/zap/assets/pdf/WATER%20MGT/WM2-%20NRW.pdf
16. EnviDan. (2023). White Paper on Reducing Urban Water Losses.
https://www.envidan.com/wp-content/uploads/2023/02/WhitePaper_NonRevenueWater.pdf
17. Zambia Ministry of Water. (2024). National Non-Revenue Water Management Strategy.
https://www.mwds.gov.zm/wp-content/uploads/2024/01/Ministry-of-Water-NATIONAL-NON-REVENUE-WATER-MANAGEMENT-STRATEGY.pdf
18. ResearchGate. (2018). Quantifying the global non-revenue water problem.
https://www.researchgate.net/publication/326238463_Quantifying_the_global_non-revenue_water_problem

Professional Support for NRW Reduction Programs and Water Loss Management
SUPRA International provides comprehensive consulting services for Non-Revenue Water reduction program design and implementation, water balance analysis, District Metered Area planning, pressure management systems, leak detection strategies, commercial loss reduction, performance benchmarking, institutional capacity building, and financing structure development. Our team supports water utilities, municipal governments, private operators, and development agencies across NRW assessment, strategic planning, technical interventions, organizational strengthening, and sustainable program implementation for improved water sector efficiency and financial sustainability.
Need expert guidance on NRW reduction strategies and implementation programs?
Contact us to discuss your water loss management and utility performance improvement needs
Share:
If you face challenges in water, waste, or energy, whether it is system reliability, regulatory compliance, efficiency, or cost control, SUPRA is here to support you. When you connect with us, our experts will have a detailed discussion to understand your specific needs and determine which phase of the full-lifecycle delivery model fits your project best.