Is Solar PV Worth It for Indonesian Businesses? A Full Financial Breakdown
Solar PV Investment Analysis: Comprehensive Cost-Benefit Framework for Indonesian Commercial Operations
Reading Time: 40 minutes
Key Highlights
• Dramatic Cost Reduction: Solar PV module prices declined 93% from USD 1.75/Wp (2010) to USD 0.13/Wp (2024), with total installed commercial rooftop system costs reaching IDR 12-18 million/kWp making solar economically competitive with grid electricity
• Financial Performance: Well-designed 100-150 kWp commercial systems achieve simple payback periods of 6-9 years, IRR of 12-18%, and NPV exceeding IDR 500-800 million over 25-year lifespans with proper system sizing and consumption matching
• Global Market Growth: Cumulative installed capacity surpassed 2.2 TW by end-2024 with over 600 GW new installations annually, while Indonesian commercial sector presents significant opportunity driven by rising electricity tariffs and improving technology economics
• Investment Decision Criteria: Five critical factors determine viability: daytime electricity consumption profile matching solar generation, adequate roof area and structural capacity, available capital or financing access, electricity tariff level above IDR 1,400/kWh, and operational timeline exceeding 10 years
International Guidelines for Solar PV Cost Analysis
Download these authoritative technical references providing detailed cost calculation methodologies, benchmarking data, and financial analysis frameworks:
1. Renewable Energy Cost Analysis: Solar Photovoltaics (IRENA, 2012)
Comprehensive baseline methodology covering equipment cost breakdowns (FOB USD 1.02-1.24/W), balance of system components, LCOE calculation framework (USD 0.25-0.71/kWh range), learning rate analysis (22% price reduction per doubling of capacity), and historical cost trend evaluation providing foundation for lifecycle cost assessment.
2. Photovoltaics Report (Fraunhofer ISE, 2024)
Latest European market analysis presenting current module prices (ASP 0.13 USD/Wp), detailed rooftop system costs for 10-100 kWp installations, learning curve updates (25.7% decline rate), 44-year price reduction trajectory, and technology efficiency improvements supporting 2024-2025 investment decision-making.
3. Renewable Power Generation Costs in 2023 (IRENA, 2024)
Most recent global cost assessment documenting utility-scale LCOE at USD 0.044/kWh (12% annual decline), comprehensive monthly module price data from 2010-2024, regional market dynamics, capacity factor improvements, and financing cost trends essential for current investment analysis and projections.
4. Snapshot of Global PV Markets 2025 (IEA-PVPS Task 1)
Forward-looking market outlook reporting cumulative capacity exceeding 2.2 TW by end-2024, over 600 GW new annual installations, regional deployment trends, commercial and industrial sector growth, policy developments, and market projections through 2025-2030 supporting strategic investment planning.
5. Best Practice Guidelines for PV System Cost Calculation (TÜV/TRUST-PV, 2016)
Technical risk assessment framework including comprehensive checklists, ±20% sensitivity analysis methodology for CAPEX/OPEX/yield variations, LCOE reduction mitigation strategies achieving up to 27% cost improvements, and standardized calculation procedures ensuring investment analysis accuracy and comparability.
Executive Summary
Solar photovoltaic technology represents increasingly attractive investment opportunity for Indonesian commercial operations seeking electricity cost reduction, energy security enhancement, and environmental sustainability objectives. Dramatic cost declines over past fourteen years transformed solar PV from niche application requiring substantial government subsidies to economically competitive energy source capable of delivering positive financial returns under appropriate conditions without external support. Global module prices fell approximately 93% from USD 1.75/Wp in 2010 to USD 0.13/Wp by 2024 according to Fraunhofer ISE data, enabling total installed system costs for commercial rooftop applications reaching IDR 12-18 million per kilowatt-peak capacity depending on system size, component specifications, installation complexity, and local market conditions.1
This comprehensive analysis examines financial and technical considerations for commercial solar PV investments in Indonesian context, providing frameworks for cost-benefit evaluation, financial modeling, and investment decision-making applicable to manufacturing facilities, warehouses, commercial buildings, hotels, hospitals, educational institutions, and other operations with substantial daytime electricity consumption. Discussion covers capital cost components and current market pricing ranges, operating savings calculations incorporating consumption patterns and electricity tariff structures, financial metrics including net present value, internal rate of return, and payback period analysis with sensitivity testing, risk factors affecting investment outcomes, regulatory and policy considerations, and go/no-go decision criteria supporting rational capital allocation across competing investment opportunities.
Indonesian commercial electricity tariffs ranging from IDR 1,115/kWh to over IDR 1,700/kWh depending on voltage level and consumption create favorable economics for solar self-consumption, with payback periods for well-designed systems typically falling within 6-10 years against 25-year operational lifespans. International Energy Agency reports global solar PV additions exceeded 600 GW in 2024, bringing cumulative installed capacity to 2.2 TW, demonstrating technology maturity and widespread adoption across diverse markets and applications.2 Indonesian market remains relatively underdeveloped compared to regional peers, presenting substantial growth opportunity as technology costs continue declining and electricity demand expands with economic development and industrialization.
Real-world case study demonstrates application of analytical frameworks to manufacturing facility evaluating 150 kWp rooftop installation with total investment of IDR 2.4 billion. Analysis incorporating actual equipment pricing, installation costs, consumption patterns, and electricity tariffs shows system achieving simple payback of 9.3 years, internal rate of return of 12.3%, and net present value exceeding IDR 650 million over 25-year evaluation period, supporting investment approval under established financial criteria. Sensitivity analysis examining variations in key assumptions including module prices, electricity tariffs, system performance, and discount rates provides risk assessment supporting decision confidence while identifying critical success factors requiring monitoring and management throughout project lifecycle.
Real Investment Case Study: Food & Beverage Manufacturing Facility
Facility Operating Profile:
Location: Industrial estate, Karawang, West Java
Business Type: Food & beverage manufacturing (snack foods production)
Monthly Electricity Consumption: 75,000 kWh average (900,000 kWh annual)
Current Electricity Cost: IDR 1,650/kWh (PLN I-3/TM tariff class)
Annual Electricity Expense: IDR 1,485,000,000
Operating Schedule: 6 days/week, 10 hours/day (06:00-16:00, daytime manufacturing)
Peak Demand Period: 08:00-15:00 (aligning well with solar generation)
Available Roof Area: 1,500 m² (south-facing orientation, minimal shading from adjacent structures)
Proposed Solar PV System Specification:
System Capacity: 150 kWp (DC rating)
Solar Panels: 273 modules × 550 Wp monocrystalline (21.2% efficiency)
Inverter Configuration: 3 units × 50 kW string inverters (98.2% efficiency)
Mounting System: Aluminum rail system with tilted configuration (15° angle)
Expected Performance Ratio: 80% (accounting for losses)
Estimated Annual Production: 210,000 kWh (1,400 kWh/kWp/year specific yield)
Self-Consumption Rate: 85% (178,500 kWh/year used directly during operations)
Excess Generation: 31,500 kWh/year (15% exported to grid or curtailed)
System Design Life: 25 years (25-year linear performance warranty on modules)
Detailed Capital Investment Breakdown:
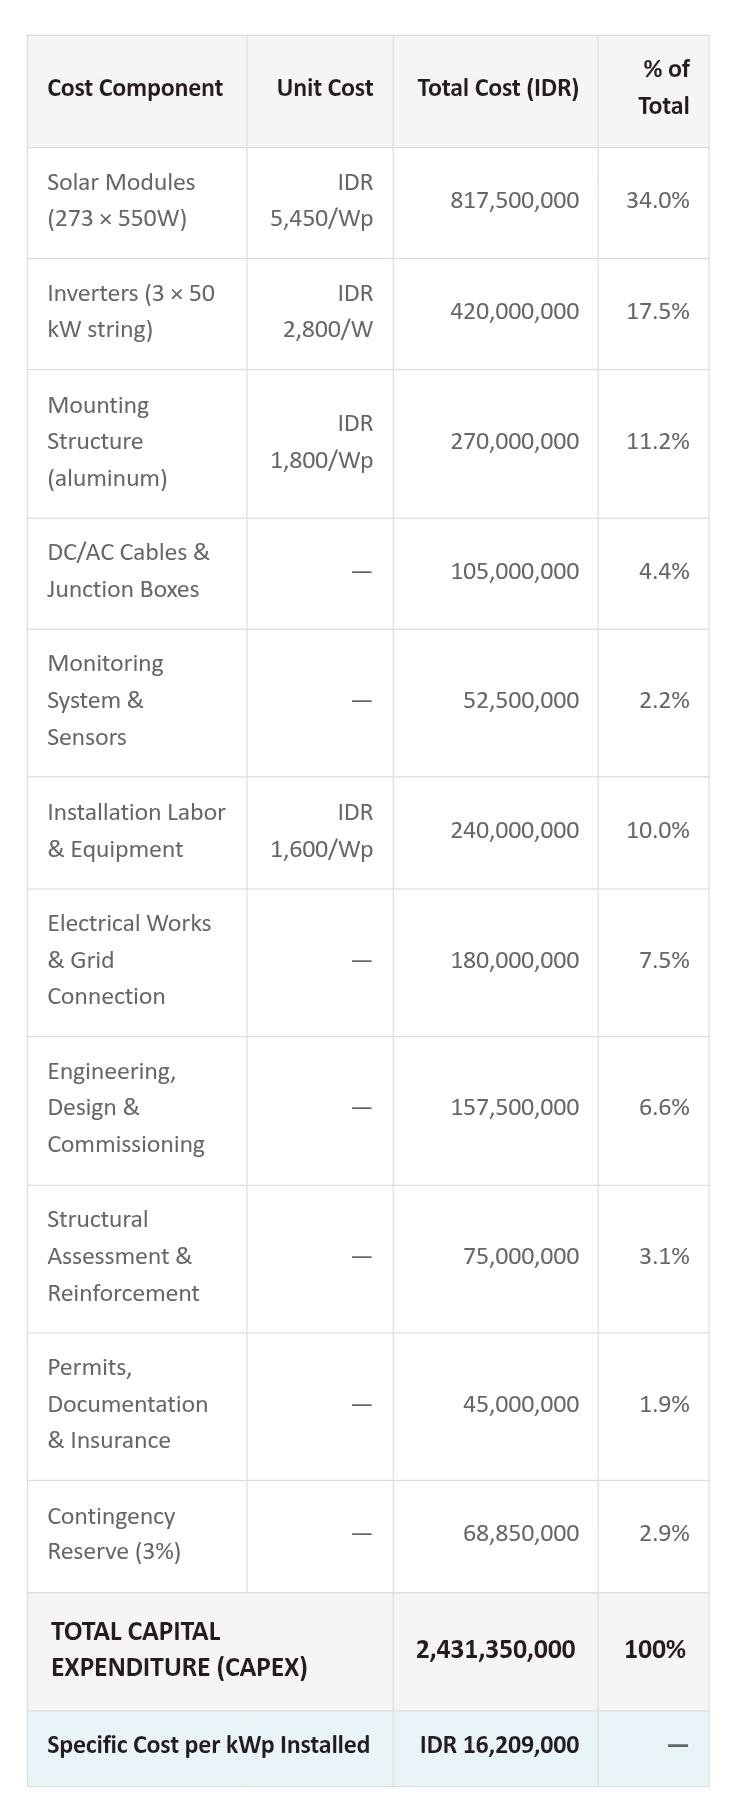
Annual Operating Costs and Electricity Savings:
Year 1 Electricity Cost Savings:
• Self-consumed generation: 178,500 kWh × IDR 1,650/kWh = IDR 294,525,000
• Excess exported (at 65% PLN rate): 31,500 kWh × IDR 1,073/kWh = IDR 33,800,000
Total Annual Savings: IDR 328,325,000
Annual Operating & Maintenance Costs:
• Preventive maintenance & cleaning: IDR 18,000,000/year (0.74% of CAPEX)
• Monitoring system & inverter servicing: IDR 7,500,000/year
• Insurance coverage: IDR 12,000,000/year (0.49% of CAPEX)
Total Annual OPEX: IDR 37,500,000
Net Annual Cash Flow:
• Year 1 net savings: IDR 290,825,000
• Performance degradation: 0.5% annual decline factored into projections
• Electricity tariff escalation: 3% annual increase assumed (conservative)
Major Rehabilitation and Replacement Costs:
Year 10: Inverter replacement (3 units) = IDR 350,000,000
Year 15: Monitoring system upgrade = IDR 45,000,000
Year 20: Second inverter replacement = IDR 280,000,000 (declining costs)
Total Lifecycle CAPEX: IDR 3,106,350,000 (initial + replacements)
Financial Performance Metrics (25-Year Analysis Period):
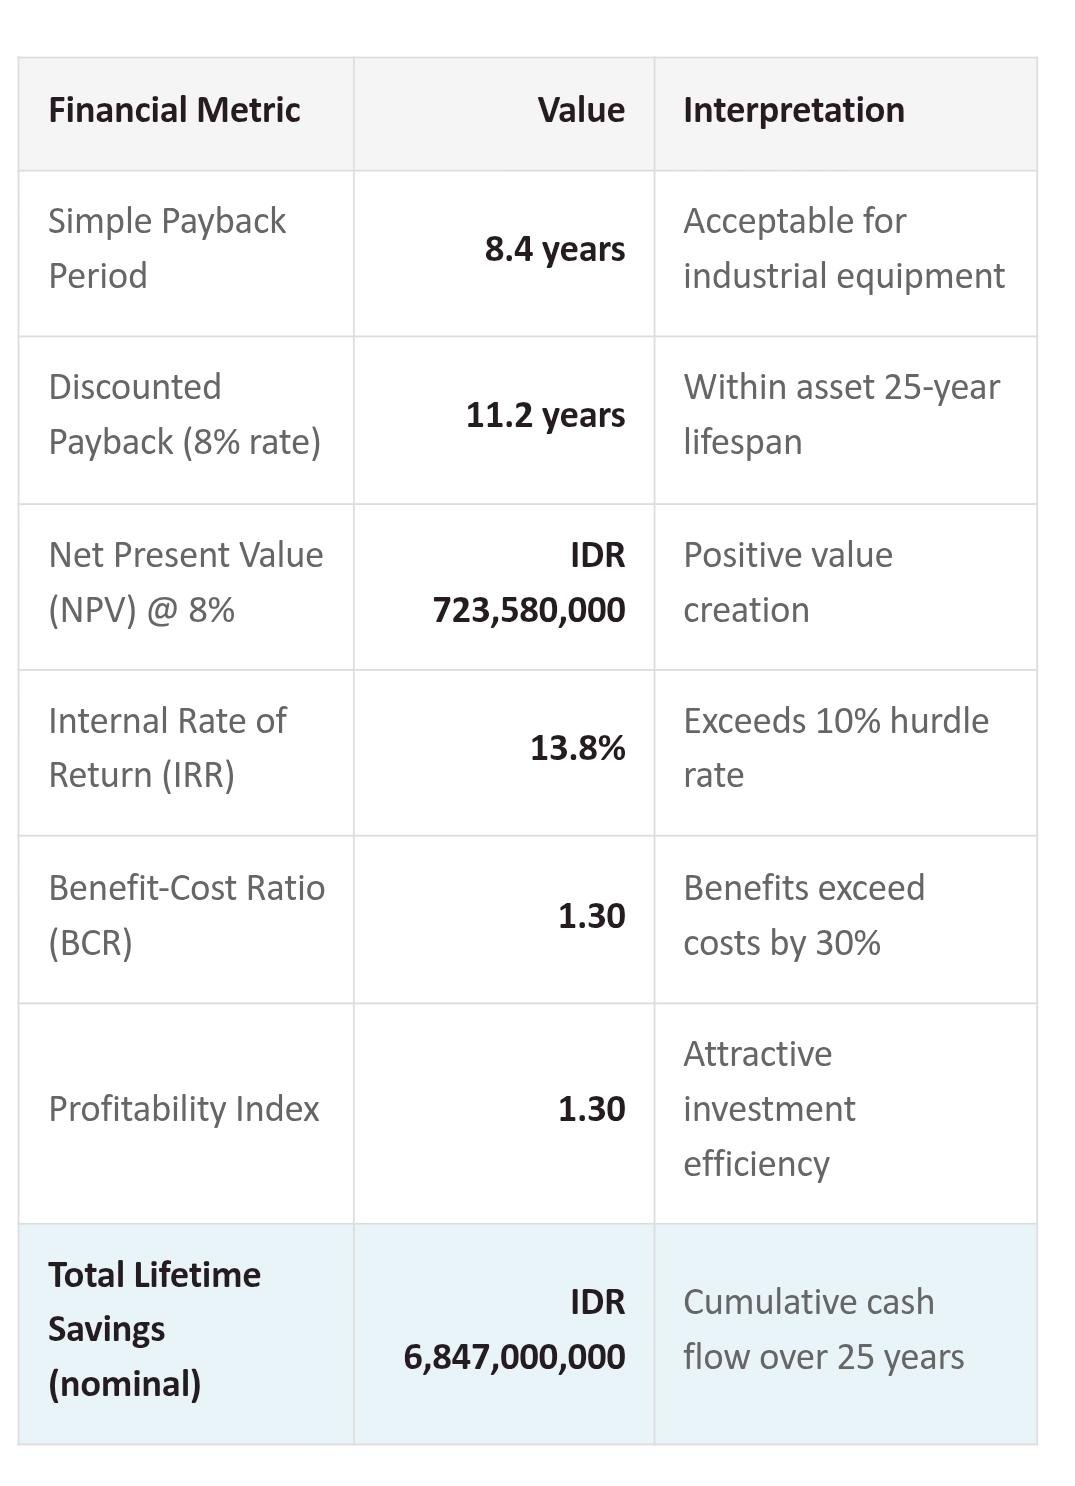
✅ Investment Decision Recommendation: Proceed
Project meets all key financial criteria with IRR (13.8%) exceeding company's weighted average cost of capital (10%), positive NPV demonstrating value creation, acceptable payback period within typical industrial equipment replacement cycles, and favorable benefit-cost ratio. Investment recommended for approval subject to final technical due diligence on roof structural capacity and grid interconnection requirements.
Understanding Solar PV Technology Cost Dynamics
Solar photovoltaic technology experienced remarkable cost reductions over past fifteen years driven by manufacturing scale economies, technological improvements, supply chain optimization, and increasing global competition. International Renewable Energy Agency data documents solar module prices declining from approximately USD 1.75/Wp in 2010 to USD 0.13/Wp by 2024, representing 93% cost reduction over fourteen-year period.1 This dramatic price reduction resulted from learning rate effects where costs decline by fixed percentage (typically 20-25%) for each doubling of cumulative installed capacity, combined with manufacturing innovations including larger wafer sizes, improved cell efficiencies, thinner wafers reducing silicon consumption, and automated production processes lowering labor content.
Understanding cost structure across solar PV system components proves essential for investment analysis and cost management. Commercial rooftop systems comprise solar modules generating electricity from sunlight, inverters converting DC power to AC electricity compatible with grid and building loads, mounting structures supporting panels on roofs or ground, electrical balance of system including cables, junction boxes, circuit breakers and protection devices, installation labor for mechanical and electrical works, and soft costs covering engineering, permits, commissioning, and project management. Component costs vary substantially based on technology choices, system size, installation complexity, and local market conditions, with modules typically representing 30-40% of total installed costs, inverters 15-20%, mounting and electrical balance of system 25-35%, and installation labor plus soft costs comprising remaining 15-25%.
Component Cost Breakdown for 100 kWp Commercial System:
Solar Modules (35% of total cost):
• Monocrystalline PERC technology: 20-22% efficiency, IDR 5,000-6,500/Wp
• Tier 1 manufacturer brands: 25-year linear performance warranty
• Typical module power: 450-600 Wp per unit
• Required quantity for 100 kWp: 180-220 modules depending on wattage
• Cost range: IDR 500-650 million for 100 kWp capacity
Inverters (18% of total cost):
• String inverters: Most economical for 50-250 kWp systems, IDR 2,500-3,500/W
• Central inverters: Economies of scale for systems exceeding 250 kWp
• Microinverters: Premium solution with module-level MPPT and monitoring
• European efficiency: 97-98% for quality units
• Typical configuration: 2-3 inverters for redundancy in 100 kWp system
• Cost range: IDR 250-350 million including installation
Mounting Structures (12% of total cost):
• Aluminum rail systems: Corrosion-resistant, lightweight, IDR 1,600-2,200/Wp
• Ballasted systems: For flat roofs without penetrations
• Tilt angle optimization: 10-15° for Indonesian latitudes
• Wind and seismic load calculations: Required for structural safety
• Cost range: IDR 160-220 million for 100 kWp mounting
Electrical Balance of System (15% of total cost):
• DC cables: Solar-rated, UV-resistant, sized for current and voltage
• AC cables: Grid connection from inverters to main panel
• Junction boxes and combiner boxes: For parallel string connection
• Circuit breakers and surge protection: Safety and grid compliance
• Grounding and earthing system: Lightning and fault protection
• Cost range: IDR 200-250 million for complete electrical works
Installation, Engineering & Soft Costs (20% of total cost):
• Installation labor: Mechanical mounting and electrical connection
• Structural assessment: Roof load capacity verification
• Engineering design: System layout, single-line diagrams, specifications
• Permits and approvals: PLN interconnection, building permits, SLO
• Commissioning and testing: Performance verification, grid synchronization
• Project management and documentation: Coordination and as-built records
• Cost range: IDR 270-330 million for complete soft costs
System size significantly influences specific costs per kilowatt-peak capacity through economies of scale in procurement, installation efficiency, and fixed cost distribution. Small systems below 10 kWp typically cost IDR 20-25 million/kWp due to high relative soft costs and less favorable equipment pricing, while medium commercial systems of 50-150 kWp achieve costs of IDR 15-18 million/kWp through better procurement and installation efficiency. Large commercial and small utility-scale systems exceeding 500 kWp can reach IDR 12-15 million/kWp through volume discounts, simplified installation on ground-mount or industrial roofs, and lower engineering costs per kilowatt. Indonesian market pricing as of 2024-2025 reflects these scale relationships though specific project costs vary substantially based on site conditions, roof complexity, grid connection requirements, and component specifications selected.
Financial Analysis Framework for Solar PV Investments
Comprehensive financial analysis evaluates solar PV investment viability through multiple metrics examining different aspects of economic performance. Simple payback period indicates years required for cumulative savings to equal initial investment, providing intuitive measure of capital recovery speed though ignoring time value of money. Net present value discounts future cash flows to present value using required rate of return, with positive NPV indicating project creates value exceeding opportunity cost of capital. Internal rate of return represents discount rate producing zero NPV, with IRR exceeding company's weighted average cost of capital or hurdle rate indicating acceptable investment. Benefit-cost ratio compares present value of benefits to present value of costs, with values exceeding 1.0 demonstrating favorable economics. These metrics provide complementary perspectives supporting informed investment decisions considering both financial returns and strategic objectives.
Calculating accurate financial metrics requires careful estimation of capital costs, operating expenses, electricity savings, system performance, and project lifetime. Capital costs include all expenditures necessary to bring system into operation, incorporating equipment procurement, installation, grid connection, permits, and commissioning as documented in previous section. Operating expenses comprise preventive maintenance including panel cleaning and inspections, inverter servicing and eventual replacement, insurance coverage, monitoring system fees, and administrative costs, typically totaling 1.0-1.5% of initial capital investment annually with major equipment replacement costs occurring at 10-15 year intervals. Electricity savings depend on system generation multiplied by avoided grid purchase costs, with generation determined by system size, location solar resource, system losses, and degradation rate while savings value reflects applicable electricity tariff and self-consumption rate determining proportion of generation directly offsetting purchases versus exported at lower compensation rates.
Key Parameters for Indonesian Commercial Solar PV Financial Analysis:
Solar Resource and Generation:
• Average solar irradiation: 4.5-5.5 kWh/m²/day depending on location
• Specific yield: 1,200-1,500 kWh/kWp/year for well-designed systems
• Performance ratio: 75-85% accounting for all system losses
• Annual degradation: 0.4-0.7% per year (linear warranty: 0.55% typical)
• Shading losses: Site-specific, should be minimized through proper design
• Soiling losses: 2-5% annually, reduced through regular cleaning
Electricity Tariffs and Escalation:
• PLN commercial tariffs (2024): IDR 1,115-1,698/kWh depending on voltage and consumption
• I-3/TM tariff (low voltage, >200 kVA): IDR 1,467-1,698/kWh typical
• I-4/TT tariff (medium voltage): IDR 1,114-1,168/kWh
• Historical escalation: 3-5% annually based on past adjustments
• Export compensation: 65% of applicable tariff under current regulations
• Net metering: Not currently available; direct export compensation only
Operating Costs:
• Annual maintenance: 0.5-1.0% of capital cost (preventive servicing, cleaning)
• Insurance: 0.3-0.5% of capital cost (equipment and liability coverage)
• Monitoring: IDR 5-10 million/year for commercial SCADA systems
• Inverter replacement: 8-12 year intervals, 60-70% of original cost
• Total OPEX: Typically 1.0-1.5% of initial CAPEX annually
Financial Assumptions:
• Analysis period: 25 years (matching panel warranty)
• Discount rate: 8-12% reflecting company WACC and project risk
• Inflation rate: 3-4% for general cost escalation
• Tax considerations: Accelerated depreciation (8 years for solar), corporate tax 22%
• Financing: Cash purchase, bank loan, or leasing arrangements
• Salvage value: Typically assumed zero for conservative analysis
Critical Success Factors:
• High self-consumption rate: >70% preferred, matching generation with daytime loads
• Adequate roof area and structural capacity: ~7-10 m² per kWp required
• Minimal shading: Avoid obstacles casting shadows on panels
• Long-term facility occupancy: Multi-year lease or owned building
• Stable or growing electricity consumption: Ensuring generated power utilization
• Favorable electricity tariff: Higher tariffs improve project economics proportionally
Sensitivity analysis examines how changes in key assumptions affect financial outcomes, identifying critical variables requiring careful management and quantifying risks from unfavorable developments. Typical sensitivity testing varies system cost ±20%, electricity tariff ±15%, system performance ±10%, and discount rate ±2 percentage points, calculating resulting changes in NPV and IRR. Well-designed investments remain viable across reasonable variation ranges, though projects showing marginal economics under base case assumptions may become uneconomical with modest adverse changes. Understanding sensitivity relationships enables risk mitigation through conservative assumptions in base case, contingency planning for adverse scenarios, and focused management attention on highest-impact variables throughout project development and operations.
Electricity Consumption Profile Analysis and System Sizing
Optimal solar PV system sizing requires detailed analysis of electricity consumption patterns matching generation capacity to daytime load profiles maximizing self-consumption while avoiding excessive generation requiring export at unfavorable rates. Indonesian commercial operations typically consume electricity during business hours aligning well with solar generation, though specific patterns vary substantially across industries with manufacturing facilities often operating extended daytime shifts, commercial buildings and offices showing weekday business hour consumption, hotels and restaurants having distributed consumption with meal service peaks, and warehouses with logistics operations showing variable patterns depending on operating schedules. Analyzing hourly or sub-hourly consumption data over representative periods identifies typical and peak load patterns, enabling system sizing optimizing financial performance through high self-consumption rates.
Self-consumption rate represents proportion of solar generation directly consumed on-site versus exported to grid, critically influencing project economics since avoided electricity purchases at retail tariffs typically provide three times greater value than export compensation at 65% of tariff under current Indonesian regulations. High self-consumption rates exceeding 80% occur when system capacity sized below minimum daytime load, ensuring continuous consumption of all generation though potentially leaving opportunity for larger systems providing greater absolute savings. Moderate self-consumption of 60-80% allows larger systems capturing more total savings despite some export, optimizing overall economics when facility has substantial and consistent daytime loads. Lower self-consumption below 60% typically indicates oversized systems generating excess power requiring export, potentially reducing financial returns unless export compensation improves or battery storage enables temporal shifting of excess generation to later consumption periods.
System Sizing Methodology and Best Practices:
Step 1 - Consumption Data Collection:
• Obtain 12 months of electricity bills showing monthly consumption
• Request interval data (hourly/15-minute) from PLN if available
• Install sub-metering for detailed load profiling if needed
• Identify consumption patterns: weekday vs weekend, seasonal variations
• Separate baseload from variable loads and peak demands
Step 2 - Generation Profile Estimation:
• Use PVsyst, PVWatts, or similar tools for location-specific simulation
• Input site coordinates for accurate solar resource data
• Account for panel tilt angle (10-15° typical for Indonesia)
• Include shading analysis using site surveys or tools
• Estimate hourly generation profile throughout year
Step 3 - Self-Consumption Analysis:
• Overlay generation profile with consumption load curve
• Calculate hourly matching between generation and load
• Determine self-consumption rate and export quantity
• Evaluate multiple system sizes to identify optimal capacity
• Consider future load growth in sizing decisions
Step 4 - Economic Optimization:
• Calculate NPV for range of system sizes (50-150% of initial target)
• Identify size maximizing NPV or meeting IRR threshold
• Balance absolute savings against utilization efficiency
• Consider roof area constraints limiting maximum size
• Evaluate modular installation phasing if uncertain about sizing
Sizing Rules of Thumb:
• Conservative approach: Size system at 60-70% of minimum daytime load
• Moderate approach: Size at 80-100% of average daytime load
• Aggressive approach: Size at 100-120% of average load, accepting some export
• Grid parity threshold: Export becomes acceptable when compensation exceeds 80% of retail
• Battery storage consideration: Enables larger systems by storing excess for evening use
Manufacturing facilities represent particularly attractive candidates for commercial solar given consistent daytime electricity consumption during production shifts. Food processing, textiles, automotive parts, electronics assembly, and other manufacturing operations typically operate 8-12 hour daytime schedules Monday through Saturday, providing excellent load matching with solar generation. These facilities often have large roof areas on production halls and warehouses, adequate structural capacity for solar installation loads, and substantial electricity consumption creating economies of scale for solar investments. Case study presented earlier demonstrates typical manufacturing application showing how detailed consumption analysis and financial modeling supports investment decisions for this favorable market segment.
Technical Due Diligence and Site Assessment Requirements
Comprehensive technical assessment verifies site suitability for solar installation, identifies potential constraints requiring mitigation, and informs accurate cost estimation supporting investment decisions. Site evaluation encompasses structural capacity analysis ensuring roofs can support additional loads from panels, mounting systems, and maintenance activities including seismic and wind loads appropriate for location; roof condition assessment examining waterproofing integrity, remaining service life, and any repairs needed before installation; shading analysis using solar pathfinders or software tools identifying obstructions casting shadows on potential installation areas; electrical infrastructure review evaluating existing switchgear capacity, cable sizing, and grid connection requirements; and space availability determination considering rooftop equipment, access pathways, and future expansion needs. These assessments typically require site visits by qualified engineers producing technical reports documenting findings and recommendations.
Structural assessment proves particularly critical given substantial weight additions from solar installations. Typical commercial PV systems add 15-20 kg/m² distributed load from panels, mounting structures, and snow/water accumulation in drainage areas, requiring verification against original design capacity with adequate safety margins. Older buildings may require structural reinforcement before solar installation, adding costs potentially affecting project viability. Structural engineers should review original building plans, conduct site inspections checking for deterioration or damage, perform load calculations including worst-case scenarios, and provide stamped certifications confirming adequacy for proposed installations. Buildings with inadequate capacity may still accommodate solar through lighter mounting systems, selective placement on strongest areas, or structural upgrades if economically justified by solar savings.
Technical Due Diligence Checklist:
Structural Engineering Assessment:
• Obtain and review building structural drawings if available
• Conduct visual inspection of roof structure and condition
• Calculate dead and live loads from proposed solar system
• Verify roof load capacity against solar system requirements
• Check seismic and wind load compliance per Indonesian codes
• Identify any required structural reinforcement
• Obtain stamped engineering letter confirming suitability
Roof Condition Evaluation:
• Assess waterproofing membrane condition and remaining life
• Identify any leaks, ponding, or drainage issues
• Check for deterioration, corrosion, or damage requiring repair
• Evaluate roof access and maintenance pathways
• Determine if roof replacement scheduled within 10 years
• Plan solar installation timing around roof maintenance needs
• Consider roof warranty impacts from penetrations
Shading and Solar Resource Analysis:
• Conduct site survey documenting surrounding structures and obstacles
• Use solar pathfinder or equivalent for shading analysis
• Simulate annual shading losses using PVsyst or similar software
• Identify optimal panel placement minimizing shade impacts
• Consider future construction that may introduce shading
• Evaluate tree trimming or obstacle removal options
• Calculate resulting specific yield (kWh/kWp/year) for site
Electrical Infrastructure Assessment:
• Review single-line diagram of existing electrical distribution
• Verify main switchboard capacity for solar interconnection
• Check available space for solar circuit breakers and metering
• Evaluate cable routing from roof to electrical room
• Assess grounding and earthing system adequacy
• Determine grid interconnection requirements and approvals needed
• Contact PLN for interconnection feasibility and process
Space and Layout Planning:
• Measure available roof area suitable for solar installation
• Identify rooftop equipment requiring clearance (HVAC, etc.)
• Plan maintenance access pathways per safety requirements
• Consider future rooftop equipment or expansion needs
• Optimize panel layout maximizing capacity within constraints
• Evaluate ground-mount options if roof area insufficient
• Calculate achievable system capacity given space limitations
Regulatory and Permitting Review:
• Identify required permits: building permit, electrical permit, SLO
• Check PLN interconnection application requirements
• Review local zoning or building restrictions on solar
• Determine if environmental or fire safety approvals needed
• Estimate permitting timeline and associated costs
• Engage local consultants familiar with approval processes
• Budget adequate contingency for permitting delays
Grid interconnection requirements vary depending on system size and local PLN distribution network characteristics. Small systems typically connect through simple notification and standard metering upgrade, while larger installations may require grid impact studies, protective relaying, and formal interconnection agreements. PLN regulations specify technical requirements including anti-islanding protection preventing solar generation during grid outages, power quality compliance ensuring harmonics and voltage variations remain within limits, and metering configurations enabling accurate tracking of generation and export for billing purposes. Early engagement with PLN during project development clarifies specific requirements, identifies potential obstacles, and prevents costly delays or modifications after construction begins.
Regulatory Framework and Policy Considerations
Indonesian solar PV development operates within regulatory framework established primarily through Ministry of Energy and Mineral Resources (ESDM) regulations governing renewable energy utilization, grid interconnection procedures, export compensation mechanisms, and technical standards. Key regulations include Minister of Energy and Mineral Resources Regulation No. 26/2021 concerning rooftop solar photovoltaic systems, which established current framework for commercial and industrial installations including simplified interconnection procedures for systems below 500 kWp and export compensation at 65% of applicable electricity tariff. Earlier Regulation No. 49/2018 governed net metering arrangements though implementation remained limited and subsequent revisions moved toward direct export compensation rather than bidirectional metering approaches common in other markets.
Export compensation mechanism significantly influences commercial solar economics by determining value captured from generation exceeding instantaneous consumption. Current 65% compensation rate for exported electricity compared to retail tariff paid for grid purchases creates strong incentive for maximizing self-consumption through careful system sizing matching generation to load profiles. This compensation level reflects policy objectives balancing renewable energy deployment encouragement with maintaining PLN financial sustainability given cross-subsidies embedded in retail tariff structures. Some industry observers advocate for higher export compensation approaching 80-100% of retail tariffs to better reflect avoided generation and transmission costs, though policy changes remain uncertain. Investors should conduct sensitivity analysis examining how NPV and IRR vary with different export compensation scenarios, ensuring projects remain viable even if policies become less favorable while benefiting from potential improvements.
Key Regulatory Requirements for Commercial Solar PV:
ESDM Regulation No. 26/2021 - Rooftop Solar PV Systems:
• Applies to grid-connected rooftop systems for own consumption
• Simplified interconnection for systems ≤500 kWp capacity
• Export compensation at 65% of applicable PLN tariff
• 10-year interconnection agreement with PLN
• Technical requirements: anti-islanding, power quality compliance
• Monitoring and reporting requirements for larger systems
Interconnection and Metering:
• Application to local PLN distribution office with technical specifications
• PLN review typically 14-30 days for standard installations
• Export-import metering required (kWh meter with directional capability)
• Monthly billing showing consumption, generation, export, and net charges
• Excess export credits may roll forward within calendar year
• No cash payment for annual net exports in most areas
Technical Standards and Safety:
• SNI standards for PV system components and installation practices
• Anti-islanding protection required per IEEE 1547 or equivalent
• Maximum harmonic distortion limits per IEC 61000-3-2
• Grounding and lightning protection per PUIL (Indonesian electrical code)
• Inverter certification requirements (typically IEC 62109 or equivalent)
• Installation by certified electrical contractors
• Commissioning tests verifying safety and performance
Permits and Approvals:
• Building permit (IMB) for structural modifications if required
• Electrical installation approval (SLO) from licensed inspector
• PLN interconnection agreement and final connection approval
• Environmental permit typically not required for rooftop systems
• Fire department notification in some jurisdictions
• Local government business license if operating as power producer
Tax and Incentive Considerations:
• Accelerated depreciation: 8-year schedule for solar assets
• Import duty exemptions: Available for equipment not locally manufactured
• VAT treatment: Generally subject to standard 11% VAT
• Corporate tax: Standard 22% rate, solar depreciation reduces taxable income
• Local incentives: Some regions offer property tax reductions for green buildings
• No feed-in tariff or production-based incentives currently available
Policy outlook remains generally supportive of commercial solar development as Indonesian government pursues renewable energy targets while managing electricity sector transition from fossil fuel dependence. National Energy Policy targets 23% renewable energy by 2025 and higher levels in subsequent years, with solar PV identified as key technology for achieving these goals given declining costs and broad applicability across residential, commercial, and utility sectors. Government initiatives including simplified interconnection procedures, development of technical standards, and promotion of local manufacturing aim to accelerate deployment. However, ongoing policy development creates some uncertainty for long-term planning, emphasizing importance of conservative financial assumptions and sensitivity analysis accommodating potential policy changes affecting export compensation, grid charges, or technical requirements over project lifetimes.
Financing Options and Capital Structure Considerations
Solar PV investments can be financed through various mechanisms including cash purchases using internal funds, bank loans providing leverage, leasing arrangements transferring ownership considerations, and emerging power purchase agreements where third parties own and operate systems while customers purchase electricity. Each approach presents distinct implications for cash flow timing, balance sheet treatment, risk allocation, and overall return on investment, requiring evaluation aligned with company financial strategy, capital availability, and risk tolerance. Cash purchases provide simplest structure with full ownership and maximum long-term savings though requiring substantial upfront capital allocation competing with other business investments. Debt financing reduces initial equity requirement enabling leverage while interest payments and debt service obligations affect cash flows and financial ratios.
Bank financing for commercial solar projects in Indonesia remains relatively limited compared to more developed markets, though several local and international banks offer specialized renewable energy lending programs. Typical commercial loans provide 60-70% loan-to-value ratios with 5-10 year tenors, requiring borrowers to contribute 30-40% equity while debt service from project savings covers loan repayment over medium term. Interest rates vary substantially based on borrower credit quality, collateral, and lender renewable energy experience, ranging from 8-14% depending on these factors. Some development finance institutions including International Finance Corporation, Asian Development Bank, and bilateral agencies provide concessional financing or risk guarantees reducing costs for qualifying projects, though these programs typically target larger installations or bundled portfolios rather than individual small-to-medium commercial systems.
Financing Structure Comparison:
Cash Purchase (100% Equity):
• Advantages: Simple structure, no interest costs, maximum savings, full ownership and control
• Disadvantages: Large upfront capital requirement, opportunity cost from alternative investments
• Typical application: Companies with available cash, strong balance sheets, long-term facility ownership
• Return consideration: IRR reflects unlevered project returns, typically 12-18% for good projects
• Financial treatment: Capitalized asset with depreciation expense over useful life
Bank Loan (60-70% Debt):
• Advantages: Leverage amplifies equity returns, preserves cash for other uses, debt tax shield
• Disadvantages: Interest costs reduce net savings, debt covenants, recourse or collateral requirements
• Typical terms: 5-10 year tenor, 8-14% interest rates, monthly debt service payments
• Return consideration: Equity IRR may reach 18-25% with favorable leverage though higher risk
• Financial treatment: Asset and liability recorded, interest expense and depreciation reduce taxable income
Operating Lease:
• Advantages: No upfront capital, off-balance sheet (if structured appropriately), monthly operating expense
• Disadvantages: Higher effective cost than ownership, lessor retains ownership and tax benefits
• Typical structure: 7-10 year lease term with buyout or renewal options
• Cost comparison: Lease payments typically 20-30% higher than debt-financed ownership equivalent
• Application: Companies preferring OpEx treatment, uncertain long-term facility occupancy
Power Purchase Agreement (Third-Party Ownership):
• Advantages: Zero upfront cost, third party handles installation/O&M, monthly electricity payments only
• Disadvantages: Lower savings versus ownership, long-term contract obligation, counterparty risk
• Typical structure: 15-20 year PPA with fixed or escalating electricity prices
• Pricing: PPA rates typically 10-15% below grid tariff, improving as third party recovers investment
• Availability: Limited in Indonesia currently, emerging with several developers entering market
Hybrid Structures:
• Partial debt financing: 40-50% debt for conservative leverage with manageable debt service
• Green bonds: For larger corporate programs with multiple sites
• Vendor financing: Equipment suppliers offering payment plans
• ESG-linked lending: Favorable terms tied to sustainability performance metrics
• Internal funds with shadow pricing: Charge business units for capital allocated to solar
Financial structuring decisions should consider interaction between financing costs, tax treatment, and project economics. Debt financing provides tax benefits through deductible interest expense while solar asset depreciation reduces taxable income, creating tax shields increasing after-tax returns. However, high leverage increases financial risk through fixed debt obligations regardless of actual system performance or electricity savings. Conservative approach uses moderate leverage of 40-60% matching debt tenor to payback period, ensuring project savings cover debt service with adequate margin for performance variations while preserving financial flexibility. Companies should compare after-tax returns across financing alternatives using consistent assumptions, considering impacts on financial statements, debt capacity for other investments, and strategic preferences regarding ownership versus contracted services.
Risk Assessment and Mitigation Strategies
Solar PV investments face various risks affecting financial performance and requiring mitigation strategies ensuring acceptable outcomes. Technical risks include equipment failures reducing generation or requiring repair costs, performance shortfalls versus projections from shading, soiling, or component deficiencies, and installation defects causing safety hazards or system damage. Financial risks encompass electricity tariff changes affecting savings value, higher-than-expected operating costs from maintenance or equipment replacement needs, and inflation or currency fluctuations for imported components or services. Market risks include changes in export compensation policies, grid connection requirements, or technical standards requiring retrofits. Operational risks span building changes affecting roof access or electrical infrastructure, lease termination or ownership changes disrupting long-term investment plans, and inadequate maintenance allowing performance degradation. Understanding these risk categories and implementing appropriate mitigation approaches protects investment returns while managing downside exposure.
Equipment warranties and insurance provide primary technical risk mitigation, with manufacturers typically offering 10-12 year product warranties on modules and 5-10 years on inverters, plus 25-year linear performance warranties guaranteeing minimum power output declining at specified degradation rates. Installer workmanship warranties covering 2-5 years protect against defects in installation though careful contractor selection through reference checking, certification verification, and portfolio review provides most effective assurance of quality work. Comprehensive insurance policies covering equipment damage from fire, lightning, theft, and natural disasters plus business interruption coverage compensating for lost production during repair periods typically cost 0.3-0.5% of system value annually, providing important downside protection. Prudent investors specify tier-1 equipment from financially stable manufacturers reducing bankruptcy risks and include adequate contingency reserves for unexpected repairs or maintenance beyond warranty coverage.
Risk Mitigation Strategies:
Technical Risk Mitigation:
• Specify tier-1 equipment from financially stable, reputable manufacturers
• Require comprehensive warranties: 25-year linear performance, 12-year product
• Select experienced EPC contractors with proven track record
• Conduct third-party quality inspections during construction
• Implement robust commissioning testing verifying performance
• Maintain comprehensive insurance covering equipment and business interruption
• Establish preventive maintenance program with qualified service providers
Financial Risk Mitigation:
• Use conservative assumptions in base case analysis (tariffs, performance, costs)
• Conduct sensitivity analysis identifying critical variables and thresholds
• Model multiple scenarios: base case, pessimistic, optimistic
• Ensure positive NPV and acceptable IRR under pessimistic scenarios
• Maintain contingency reserves for unexpected costs (5-10% of CAPEX)
• Lock in financing terms at commitment to avoid interest rate changes
• Consider fixed-price EPC contracts transferring construction cost risk
Policy and Regulatory Risk Mitigation:
• Advocate through industry associations for stable, supportive policies
• Structure projects remaining viable under less favorable policy scenarios
• Monitor policy developments and engage proactively with regulators
• Size systems for high self-consumption reducing export policy sensitivity
• Maintain flexibility for future battery storage integration if policies change
• Document interconnection agreements establishing rights and obligations
• Budget for compliance with evolving technical standards
Operational Risk Mitigation:
• Align solar investment timing with building ownership or long-term lease commitments
• Include solar system provisions in lease agreements clarifying ownership
• Select mounting systems allowing removal and reinstallation if relocation needed
• Establish clear operations and maintenance responsibilities and procedures
• Implement monitoring systems providing real-time performance visibility
• Train facility staff on basic system operation and troubleshooting
• Maintain relationships with qualified service providers for technical support
Performance monitoring systems provide ongoing risk management through early detection of problems requiring intervention. Modern inverters include built-in monitoring communicating production data via internet to cloud platforms accessible through computers or smartphones, enabling real-time visibility into system performance with automated alerts for failures, underperformance, or anomalies. More sophisticated monitoring adds string-level or module-level current sensing identifying specific underperforming components, weather station data normalizing performance for irradiation variations, and analytics comparing actual versus expected production flagging degradation or soiling requiring attention. Regular performance review comparing actual generation against predictions, analyzing losses and their sources, and trending efficiency over time enables proactive maintenance and optimization maximizing return on investment throughout system lifetime.
Go/No-Go Decision Framework
Systematic decision framework evaluates solar PV investment opportunities against multiple criteria determining whether projects merit approval and capital allocation. Financial criteria establish minimum acceptable performance including required internal rate of return reflecting company's cost of capital and renewable energy project risk profile, maximum acceptable payback period aligning with capital budgeting practices, and positive net present value demonstrating value creation after risk adjustment. Technical criteria verify site suitability including adequate roof area and structural capacity, favorable solar resource and minimal shading, sufficient daytime electricity consumption enabling high self-consumption, and compliance with grid interconnection requirements. Strategic criteria examine alignment with sustainability commitments, corporate image and stakeholder expectations, energy security and price stability objectives, and contribution toward regulatory compliance if renewable energy requirements exist. Projects must satisfy all critical criteria while showing favorable scoring across evaluation framework to receive approval competing against alternative capital investments.
Financial hurdle rates for commercial solar investments typically range from 10-15% IRR depending on company cost of capital, project risk assessment, and strategic value attributed to renewable energy adoption. Companies with low cost of capital and strong sustainability commitments may accept lower returns around 10-12% recognizing strategic benefits beyond pure financial returns, while businesses emphasizing financial performance or facing higher capital costs require 15% or higher returns justifying solar investment versus alternatives. Payback period thresholds commonly fall between 6-10 years for commercial solar, with shorter paybacks improving project attractiveness though excessively short thresholds may exclude viable investments offering strong long-term returns. Decision frameworks should examine both discounted and simple payback recognizing that while discounted figures provide theoretically correct measurement, simple payback offers intuitive appeal for management communication and decision processes.
✅ Investment Decision Checklist
Financial Criteria (Must Meet All):
□ Internal Rate of Return (IRR) ≥ 10-12% minimum, ≥ 15% preferred
□ Net Present Value (NPV) > IDR 0 at 8-10% discount rate
□ Simple Payback Period ≤ 10 years, ≤ 8 years preferred
□ Discounted Payback ≤ 15 years (within half of project lifetime)
□ Benefit-Cost Ratio (BCR) ≥ 1.2 providing adequate value margin
□ Sensitivity analysis shows positive NPV under pessimistic scenarios
□ Total investment within approved capital budget allocation
Technical Feasibility (Must Meet All):
□ Adequate roof area: ≥7-10 m² per kWp required capacity
□ Sufficient structural capacity verified by qualified engineer
□ Minimal shading: <10% annual energy loss from obstructions
□ Good solar resource: ≥4.5 kWh/m²/day annual average irradiation
□ Electrical infrastructure adequate for grid interconnection
□ PLN interconnection feasibility confirmed (for grid-connected systems)
□ Roof condition good with ≥15 years remaining service life
Operational Alignment (Should Meet Most):
□ Substantial daytime electricity consumption (≥60% of total)
□ High self-consumption rate achievable (≥70% preferred)
□ Electricity tariff ≥IDR 1,400/kWh improving project economics
□ Stable load profile: Consistent operating schedule and consumption
□ Long-term facility occupancy: ≥10 year ownership or lease commitment
□ Adequate maintenance capability: In-house or contracted service available
□ Management support: Champions advocating for project approval
Strategic Value (Consider for Approval):
□ Advances corporate sustainability commitments and targets
□ Enhances corporate image and stakeholder relations
□ Reduces exposure to electricity price volatility and uncertainty
□ Contributes toward renewable energy procurement requirements
□ Demonstrates innovation and environmental leadership
□ Provides employee engagement and morale benefits
□ Creates learning opportunities for future renewable energy projects
Red Flags (Investigate Further or Reject):
✗ IRR below company hurdle rate or cost of capital
✗ Payback period exceeding 12 years (risk of technology obsolescence)
✗ Self-consumption rate below 50% (excessive export dependency)
✗ Structural inadequacy requiring expensive reinforcement
✗ Severe shading reducing production by >20%
✗ Uncertain facility occupancy or short-term lease (<5 years remaining)
✗ Low electricity tariff (
✗ Poor installer track record or equipment from unknown manufacturers
✗ PLN interconnection obstacles or grid capacity constraints
Decision-making process should involve multidisciplinary input including finance teams evaluating returns and capital requirements, facilities managers assessing technical feasibility and maintenance implications, operations managers confirming load profiles and consumption patterns, sustainability coordinators aligning with environmental strategy, and senior management providing strategic guidance and final approval authority. Larger investments typically require board-level approval following detailed evaluation and presentation, while smaller projects may receive approval through capital appropriation request processes with delegated authority to facilities or sustainability directors. Documentation supporting approval should include executive summary with recommendation, financial analysis showing NPV, IRR, and payback calculations, technical due diligence reports, sensitivity analysis examining key assumptions, risk assessment with mitigation plans, and implementation timeline with milestones and responsible parties.
Implementation Planning and Project Execution
Successful solar PV project execution requires careful planning across procurement, installation, commissioning, and operations phases ensuring systems perform as designed while meeting schedule and budget objectives. Project implementation typically spans 4-8 months from approval to operation for commercial installations, with timeline variations depending on system size, site complexity, equipment lead times, permitting duration, and contractor schedules. Detailed planning identifies critical path activities, sequences work efficiently, allocates responsibilities, and establishes tracking mechanisms ensuring timely problem identification and resolution. Organizations lacking solar experience benefit from engaging experienced consultants or EPC contractors providing turnkey solutions including design, procurement, installation, commissioning, and training, though careful contractor selection through competitive bidding, reference checking, and contract negotiation remains essential for value optimization.
Equipment procurement decisions balance cost, quality, warranties, and delivery considerations. Solar modules should specify tier-1 manufacturers with proven reliability, adequate warranties, bankability for potential financing, and delivery timeframes matching project schedules. Inverters require matching specifications to DC array characteristics while providing necessary grid interconnection features, monitoring capabilities, and service support availability. Mounting structures must meet wind and seismic loads per site requirements while allowing efficient installation and future maintenance access. Balance of system components including cables, junction boxes, circuit breakers, and grounding should use appropriate specifications for solar applications with adequate safety margins. Procurement strategies include requesting multiple competitive quotes, negotiating payment terms aligning with project milestones, specifying delivery schedules with liquidated damages for delays, and arranging equipment inspections verifying compliance with specifications before acceptance.
Project Implementation Phases and Timeline:
Phase 1 - Detailed Design and Engineering (4-6 weeks):
• Finalize system layout and panel placement optimizing production
• Complete electrical single-line diagrams and specifications
• Conduct structural calculations and prepare mounting drawings
• Develop installation methodology and safety plans
• Prepare permit application packages
• Issue equipment procurement specifications
Phase 2 - Permitting and Approvals (4-8 weeks):
• Submit building permit and structural approval applications
• File PLN interconnection application with technical documentation
• Obtain electrical installation approval (SLO) for design
• Secure any required environmental or fire safety clearances
• Address authority comments or requests for additional information
• Obtain final permits and interconnection agreement
Phase 3 - Procurement and Manufacturing (6-10 weeks):
• Issue purchase orders for modules, inverters, BOS components
• Monitor equipment manufacturing and quality control
• Arrange shipping and customs clearance for imports
• Conduct factory acceptance testing for inverters if specified
• Coordinate delivery timing with installation schedule
• Verify equipment receipt and inspect for shipping damage
Phase 4 - Site Preparation and Installation (4-8 weeks):
• Mobilize installation crew and equipment to site
• Install mounting structures and verify alignment
• Mount solar panels and complete mechanical assembly
• Install inverters and electrical balance of system
• Run DC and AC cabling with proper terminations
• Implement grounding and lightning protection system
• Install monitoring system and communications
Phase 5 - Testing and Commissioning (2-3 weeks):
• Conduct electrical testing: insulation resistance, continuity, polarity
• Verify protective device settings and coordination
• Test inverter functionality and grid synchronization
• Commission monitoring system and verify data transmission
• Conduct performance verification at various operating points
• Complete punch list items and final inspections
• Obtain PLN final interconnection approval and metering activation
Phase 6 - Training and Handover (1 week):
• Train facility staff on system operation and monitoring
• Provide troubleshooting guidance for common issues
• Transfer all documentation: manuals, drawings, test reports
• Establish maintenance schedule and procedures
• Arrange service contracts if third-party maintenance planned
• Conduct final acceptance and warranty registration
Quality assurance during installation prevents problems compromising system performance or safety. Owner representatives or independent engineers should conduct periodic site inspections verifying work quality, compliance with specifications and codes, proper installation techniques, and adherence to safety procedures. Key checkpoints include structural mounting integrity with proper flashing and waterproofing, electrical connections made per manufacturer specifications with appropriate torque and termination hardware, cable routing protected from UV exposure and mechanical damage, grounding continuity throughout system, and inverter settings configured correctly for grid parameters. Photographic documentation at each stage creates record supporting warranty claims while comprehensive testing during commissioning verifies system readiness for operation.
Operations, Maintenance, and Performance Management
Ongoing operations and maintenance ensure solar systems deliver expected performance throughout design lifespans while minimizing failures and extending asset longevity. Maintenance requirements for solar PV remain relatively modest compared to rotating equipment or combustion systems, though preventive maintenance programs addressing key activities prove essential for optimizing returns. Panel cleaning removes dust, pollen, bird droppings, and other soiling reducing light transmission and electricity production, with cleaning frequency depending on local conditions ranging from quarterly in dusty or polluted environments to annually in cleaner locations. Visual inspections identify physical damage from weather, animals, or vandalism requiring repair, loose connections risking failures, and vegetation growth causing shading. Electrical testing verifies system performance, detects degradation trends, and catches developing problems before failures occur. Inverter maintenance includes cooling system cleaning, firmware updates, and eventual replacement after 10-15 years when components reach end of useful life.
Performance monitoring provides visibility into system operation enabling early problem detection and optimization. Modern inverters transmit real-time production data to cloud platforms accessible via web browsers or mobile apps, allowing facility managers to check daily generation, identify offline equipment, and receive automated alerts for failures or underperformance. More sophisticated monitoring analyzes weather-normalized production comparing actual versus expected performance accounting for varying solar irradiation, trending efficiency over time to detect degradation, and disaggregating losses between soiling, shading, equipment issues, and grid curtailment. Regularly reviewing performance metrics including specific yield (kWh/kWp/year), performance ratio (actual vs theoretical production), availability (percentage of time operating), and financial metrics (savings vs projections) enables informed management decisions about maintenance needs, warranty claims for underperforming equipment, and optimization opportunities improving returns.
Maintenance Schedule and Best Practices:
Quarterly Maintenance Activities:
• Panel cleaning: Remove soiling to maintain production (more frequent if needed)
• Visual inspection: Check for physical damage, animal nesting, vegetation
• Monitoring review: Analyze production trends and identify anomalies
• Inverter inspection: Check error logs, cooling fans, display status
• Electrical connections: Tighten any loose terminals, check for corrosion
• Safety systems: Verify disconnect switches and emergency stops function
Annual Maintenance Activities:
• Comprehensive electrical testing: IR imaging, I-V curve tracing
• String voltage and current measurements: Verify uniformity and design values
• Inverter servicing: Detailed inspection, filter cleaning, firmware updates
• Structural inspection: Check mounting hardware torque and integrity
• Grounding system testing: Measure earth resistance, verify bonding
• Performance testing: Compare actual versus warranted output
• Documentation update: Maintain maintenance logs and equipment records
As-Needed Activities:
• Panel replacement: For units with physical damage or manufacturing defects
• Inverter repair or replacement: Upon failures or reaching end of life
• Wiring repairs: Address damage from rodents, weather, or deterioration
• Monitoring system service: Fix communication failures or sensor issues
• Vegetation management: Trim trees or remove plants causing shading
• Roof repairs: Fix leaks or damage related to solar installation
• Grid interconnection troubleshooting: Resolve utility connection problems
Performance Optimization:
• Cleaning schedule optimization: Analyze soiling losses versus cleaning costs
• Inverter MPPT tuning: Optimize maximum power point tracking settings
• Shading mitigation: Install panel-level optimization if shading develops
• Load management: Shift discretionary loads to maximize self-consumption
• Monitoring enhancement: Add sensors or analytics for better insights
• Warranty claims: Document and pursue claims for underperforming equipment
• Continuous improvement: Apply lessons learned to future installations
Facility staff can handle basic operations and monitoring with appropriate training, while technical maintenance often justifies engaging specialized service providers particularly for larger installations. In-house responsibilities typically include daily production monitoring through inverter platforms, monthly performance reporting comparing generation versus projections, routine panel cleaning using appropriate methods avoiding damage, visual inspections identifying obvious problems, and coordination with external service providers for technical work. External service contracts should specify scope clearly including inspection frequency, testing protocols, response times for failures, spare parts coverage, and performance guarantees. Evaluating service provider qualifications through reference checks with existing clients, verification of technician certifications, and assessment of spare parts inventory and support infrastructure ensures capable maintenance support throughout system lifetime.
Frequently Asked Questions About Commercial Solar PV Investment
1. What is the typical payback period for commercial solar PV systems in Indonesia?
Payback periods for well-designed commercial solar PV systems typically range from 6-10 years depending on system size, electricity consumption patterns, and tariff rates. Manufacturing facilities with high daytime consumption and electricity costs above IDR 1,500/kWh often achieve paybacks toward lower end of this range (6-7 years), while operations with lower tariffs or moderate consumption see longer paybacks (8-10 years). Simple payback dividing total investment by annual savings provides intuitive metric, though discounted payback accounting for time value of money typically adds 2-4 years. Systems remaining uneconomical beyond 12-year payback should be reconsidered unless strong strategic justifications exist, as technology obsolescence and uncertainty increase with longer recovery periods.
2. How much roof area is required for commercial solar PV installation?
Commercial solar PV systems typically require 7-10 m² of roof area per kilowatt-peak (kWp) of installed capacity depending on module efficiency and mounting configuration. Modern 550W modules with 21% efficiency need approximately 2.6 m² per panel, translating to roughly 7.5 m² per kWp including spacing between rows for shading prevention and maintenance access. Therefore, 100 kWp system requires approximately 750-1,000 m² of suitable roof area, while 150 kWp needs 1,050-1,500 m². Flat roofs require more space than tilted configurations due to row spacing preventing mutual shading, while irregular roof shapes with numerous rooftop equipment or obstructions reduce usable area. Structural capacity proves equally important as area, with systems adding 15-20 kg/m² of distributed load requiring engineering verification.
3. What are the main operating costs for commercial solar PV systems?
Annual operating costs for commercial solar PV typically total 1.0-1.5% of initial capital investment, comprising preventive maintenance (0.5-1.0%), insurance (0.3-0.5%), and monitoring systems (0.2-0.3%). For IDR 2 billion system, expect annual OPEX around IDR 20-30 million including quarterly panel cleaning, annual electrical testing, inverter servicing, and comprehensive insurance coverage. Major equipment replacement costs occur periodically rather than annually, with inverters requiring replacement every 10-15 years at 60-70% of original cost and monitoring systems needing updates every 10-15 years. Panel cleaning frequency depends on local conditions with urban or industrial environments requiring quarterly cleaning while rural installations may need only annual cleaning. Proper maintenance optimizes performance and extends equipment life, typically improving overall returns despite modest ongoing costs.
4. How does the 65% export compensation policy affect project economics?
Current Indonesian regulation compensates exported solar electricity at 65% of applicable PLN tariff, creating strong incentive for maximizing self-consumption rather than relying on grid export. For facility paying IDR 1,650/kWh retail tariff, self-consumed generation saves full tariff amount while exported electricity earns only IDR 1,073/kWh (65% × IDR 1,650). This 35% reduction in export value significantly impacts projects with low self-consumption rates below 70%, potentially reducing IRR by 2-4 percentage points compared to hypothetical full tariff compensation. Well-designed systems achieve 75-90% self-consumption through careful sizing matching generation to daytime loads, minimizing export dependency. Sensitivity analysis should test project viability under scenarios where export compensation remains at current 65% level or potentially declines, ensuring investments remain sound even without policy improvements while benefiting if compensation increases toward 80-100% advocated by some industry participants.
5. What financial incentives or tax benefits are available for commercial solar in Indonesia?
Indonesian solar PV investments benefit primarily from accelerated depreciation allowing 8-year tax depreciation schedule compared to standard 20-year building improvement category, providing earlier tax deductions reducing taxable income. For company in 22% corporate tax bracket, IDR 2 billion solar investment generates approximately IDR 55 million annual depreciation tax shield (IDR 250 million depreciation × 22% tax rate) over eight years compared to IDR 22 million under standard 20-year schedule. Import duty exemptions apply for solar equipment not manufactured locally, reducing procurement costs by 5-15% depending on component types and origin countries. Some municipalities offer property tax reductions for green buildings including solar installations, though availability varies by location. Indonesia currently lacks feed-in tariffs, production tax credits, or investment tax credits common in some markets, making project economics dependent primarily on electricity savings rather than incentive payments. Proposed renewable energy incentives under discussion may improve economics if implemented, though investors should base decisions on current policy rather than anticipated improvements.
6. How long do commercial solar PV systems last and what performance degradation should be expected?
Quality solar PV systems demonstrate 25-30 year operational lifespans with proper maintenance, though performance gradually declines through degradation. Crystalline silicon modules typically degrade at 0.4-0.7% annually with tier-1 manufacturers warranting ≤0.55% annual degradation, resulting in 80-85% of original capacity remaining after 25 years. Inverters have shorter lifespans of 10-15 years requiring replacement 1-2 times over system lifetime, while mounting structures and electrical components generally last full 25-30 years. Fraunhofer ISE research documents median degradation rate of 0.5% per year for modern modules, meaning 100 kWp system producing 140,000 kWh initially generates approximately 133,000 kWh after 10 years and 120,000 kWh after 25 years.1 Financial analysis should incorporate realistic degradation assumptions in production projections, with conservative analyses using 0.6-0.7% annual degradation providing cushion versus typical performance while optimistic scenarios assume 0.4-0.5% for best-case equipment.
7. Is battery storage economically viable for commercial solar PV systems?
Battery energy storage systems (BESS) paired with solar PV remain economically challenging for most Indonesian commercial applications as of 2024-2025 due to high battery costs (IDR 3,000-5,000/Wh for lithium-ion systems) and limited value proposition under current tariff structures and policies. Storage adds IDR 450-750 million to 100 kWh system suitable for shifting 25-30 kWp of solar generation from midday to evening, with batteries requiring replacement every 8-12 years adding lifecycle costs. Economic value comes from time-of-use arbitrage (storing low-cost daytime solar for high-cost evening use), demand charge reduction, and backup power during outages. Indonesia's relatively flat commercial tariffs without time-of-use pricing limit arbitrage value, while many facilities have adequate daytime loads for high self-consumption without storage. Battery economics improve for operations with significant evening consumption, high demand charges, or critical backup power requirements justifying premium costs. Declining battery prices may improve viability by late 2020s, suggesting deferring storage until costs decline further unless specific operational needs justify current investment.
8. What are the key factors that make solar PV investment attractive or unattractive for specific businesses?
Five critical factors determine solar PV investment attractiveness: (1) Daytime electricity consumption with operations during solar generation hours (06:00-18:00) essential for self-consumption; (2) High electricity tariffs above IDR 1,400/kWh improving payback periods with higher tariffs providing proportionally better returns; (3) Available roof area and structural capacity with manufacturing facilities, warehouses, and large commercial buildings offering better opportunities than space-constrained operations; (4) Long-term facility occupancy exceeding 10 years ensuring sufficient time for investment recovery with owned buildings ideal and long-term leases acceptable; (5) Capital availability or financing access enabling upfront investment or leverage. Manufacturing facilities typically present most attractive opportunities combining high daytime loads, substantial tariffs, large roof areas, long-term occupancy, and operational focus on cost reduction. Retail operations, restaurants, or service businesses with evening-weighted consumption, limited roof area, or short-term leases often find solar economics less compelling absent strong strategic sustainability drivers justifying below-threshold financial returns.
9. How can companies finance commercial solar PV without using internal cash?
Several financing alternatives enable solar investment without depleting internal cash reserves: (1) Bank loans provide 60-70% financing with 5-10 year terms at 8-14% interest rates, requiring 30-40% equity contribution while debt service is paid from electricity savings; (2) Operating leases allow monthly payments over 7-10 years treating solar as operating expense rather than capital investment, though total costs typically exceed purchase equivalent by 20-30%; (3) Power purchase agreements (PPAs) involve third-party investors owning and operating systems while customers purchase generated electricity at contracted rates typically 10-15% below grid tariffs, though PPA availability remains limited in Indonesian market; (4) Vendor financing from equipment suppliers or installation companies offering payment plans spreading costs over 2-4 years; (5) Green bonds or sustainability-linked loans potentially offering favorable terms for renewable energy investments meeting environmental criteria. Each option presents distinct implications for cash flow, financial statements, risk allocation, and overall returns requiring evaluation aligned with company financial strategy and constraints.
10. What are the most common mistakes in commercial solar PV investment analysis?
Common analytical errors include: (1) Oversizing systems beyond daytime load capacity resulting in excessive export at unfavorable compensation rates, typically occurring when analyzing only monthly or annual consumption without hourly load profiling; (2) Using overly optimistic performance assumptions including unrealistic specific yields exceeding 1,500 kWh/kWp/year for most Indonesian locations or ignoring degradation and soiling losses; (3) Underestimating soft costs and installation complexity with inadequate budgets for structural work, grid interconnection, or permitting; (4) Ignoring operating expenses and equipment replacement costs treating solar as maintenance-free investment when reality requires ongoing attention and periodic inverter replacement; (5) Failing to conduct sensitivity analysis leaving project vulnerable to adverse changes in tariffs, performance, or costs; (6) Neglecting qualitative factors including roof condition, facility ownership certainty, and maintenance capability focusing solely on financial metrics; (7) Accepting unrealistically low quotes from unqualified contractors leading to quality problems and performance shortfalls. Comprehensive due diligence, conservative assumptions, and multi-scenario analysis mitigate these risks supporting sound investment decisions.
Conclusions and Strategic Recommendations
Commercial solar PV investments present increasingly attractive opportunities for Indonesian businesses driven by dramatic technology cost reductions, rising electricity tariffs, improving project economics, and growing sustainability awareness. Module prices declining 93% from USD 1.75/Wp (2010) to USD 0.13/Wp (2024) enabled total installed system costs reaching IDR 12-18 million/kWp for commercial rooftop applications, while PLN commercial tariffs ranging from IDR 1,115-1,698/kWh create favorable economics for self-consumption. Well-designed systems sized appropriately for consumption profiles and site constraints typically achieve 6-10 year payback periods, 12-18% internal rates of return, and positive net present values providing value creation exceeding opportunity costs of capital deployed.
Successful solar investments require comprehensive analysis spanning financial modeling with NPV, IRR, and payback calculations under multiple scenarios; technical due diligence verifying roof capacity, generation potential, and grid interconnection feasibility; operational assessment ensuring consumption patterns align with generation profiles enabling high self-consumption; and strategic evaluation confirming alignment with corporate sustainability objectives and risk tolerance. Decision framework should examine projects against minimum financial hurdle rates typically 10-15% IRR depending on company cost of capital, verify positive NPV under pessimistic assumptions testing downside risk, and ensure acceptable payback periods generally under 10 years for industrial capital equipment. Projects meeting all critical financial, technical, and strategic criteria warrant approval and capital allocation competing effectively against alternative investments.
Implementation success depends on careful contractor selection, equipment procurement from reputable manufacturers, quality installation practices, comprehensive commissioning verification, and ongoing performance management through monitoring and preventive maintenance. Organizations lacking solar experience should engage qualified consultants or EPC contractors providing turnkey solutions including design, procurement, installation, commissioning, and initial operations support while transferring knowledge enabling internal management. Establishing clear project governance, milestone-based contractor payments, independent quality oversight, and comprehensive documentation creates foundation for successful execution meeting performance, schedule, and budget objectives.
Looking forward, Indonesian commercial solar market presents substantial growth opportunity as technology costs continue declining, electricity demand expands with economic development, tariffs trend upward reflecting generation costs and environmental externalities, and policy frameworks evolve supporting renewable energy adoption. Companies establishing solar capability now through initial investments, learning from early implementations, and building internal expertise or trusted contractor relationships position advantageously for multiple installations across facility portfolios over coming years. Solar investment decisions today should balance immediate financial returns with strategic positioning for long-term energy cost management, sustainability leadership, and resilience against electricity market uncertainties creating compelling value proposition transcending pure financial considerations.
References and Data Sources:
1. Fraunhofer Institute for Solar Energy Systems ISE. (2024). Photovoltaics Report.
https://www.ise.fraunhofer.de/content/dam/ise/de/documents/publications/studies/Photovoltaics-Report.pdf
2. International Energy Agency Photovoltaic Power Systems Programme (IEA-PVPS). (2025). Snapshot of Global PV Markets 2025.
https://iea-pvps.org/wp-content/uploads/2025/04/Snapshot-of-Global-PV-Markets_2025.pdf
3. International Renewable Energy Agency (IRENA). (2024). Renewable Power Generation Costs in 2023.
https://www.irena.org/-/media/Files/IRENA/Agency/Publication/2024/Sep/IRENA_Renewable_power_generation_costs_in_2023.pdf
4. International Renewable Energy Agency (IRENA). (2012). Renewable Energy Technologies: Cost Analysis Series - Solar Photovoltaics.
https://www.irena.org/-/media/Files/IRENA/Agency/Publication/2012/RE_Technologies_Cost_Analysis-SOLAR_PV.pdf
5. TÜV Rheinland / TRUST-PV Project. (2016). Best Practice Guidelines for PV System Cost Calculation.
https://trust-pv.eu/wp-content/uploads/2024/04/20161213_649997_Best_Practice_Guidelines_for_PV_Cost_Calculation_20161213.pdf
6. Ministry of Energy and Mineral Resources (ESDM). (2021). Regulation No. 26/2021 on Rooftop Solar Photovoltaic Systems.
7. National Renewable Energy Laboratory (NREL). (2024). Commercial Solar Energy System Cost Benchmark.
https://www.nrel.gov/solar/market-research-analysis/solar-installed-system-cost.html
8. PT PLN (Persero). (2024). Electricity Tariff Adjustments and Commercial Rate Structures.
9. Asian Development Bank (ADB). (2023). Renewable Energy Investment in Southeast Asia.
https://www.adb.org/publications/renewable-energy-investments-asia
10. Bloomberg New Energy Finance (BNEF). (2024). Solar PV Module Price Index and Market Outlook.
11. International Finance Corporation (IFC). (2023). Utility-Scale Solar Photovoltaic Power Plants: Project Developer's Guide.
https://www.ifc.org/solar
12. PVSyst SA. (2024). PVSyst Photovoltaic Software: Simulation and Sizing Tools.
13. Solar Energy Industries Association (SEIA). (2024). Commercial Solar Installation Best Practices Guide.
14. Indonesian Solar Energy Association (AESI). (2024). Indonesian Solar Market Report.
15. Institute for Essential Services Reform (IESR). (2024). Indonesia Clean Energy Outlook.

Professional Solar PV Investment Analysis and Implementation Services
SUPRA International provides comprehensive consulting services for commercial solar PV investment analysis, feasibility studies, financial modeling, technical due diligence, system design, procurement support, installation oversight, and operations management. Our multidisciplinary team supports manufacturing facilities, commercial buildings, industrial parks, hotels, hospitals, and other operations across project development lifecycle from initial concept through commissioning and ongoing performance optimization, ensuring solar investments deliver expected financial returns and operational performance.
Services include consumption profile analysis and system sizing optimization, roof structural assessment and technical feasibility evaluation, equipment specification and vendor qualification, financial analysis with NPV/IRR calculations and sensitivity testing, permitting and PLN interconnection support, EPC contractor selection and contract negotiation, construction quality oversight and commissioning verification, and operations support including monitoring, maintenance program development, and performance management ensuring lifecycle value realization.
Evaluating solar PV investment opportunity for your commercial operations?
Contact us to discuss feasibility assessment, financial analysis, and implementation support services
Share:
If you face challenges in water, waste, or energy, whether it is system reliability, regulatory compliance, efficiency, or cost control, SUPRA is here to support you. When you connect with us, our experts will have a detailed discussion to understand your specific needs and determine which phase of the full-lifecycle delivery model fits your project best.