Introduction to EPANET Hydraulic Modeling Software for Non Revenue Water Reduction
EPANET Hydraulic Modeling Software: Comprehensive Technical Framework for Non-Revenue Water Reduction, Distribution Network Optimization, Pressure Management Implementation, Leak Detection Integration, and Water Loss Control in Indonesian Municipal Systems
Reading time: 88 minutes
Key Highlights
• EPANET as Strategic NRW Reduction Tool: EPANET (Environmental Protection Agency Network) represents powerful, open-source hydraulic modeling software enabling water utilities to simulate distribution network behavior under various operational scenarios, predict pressure distributions, optimize pipe sizing, design pressure management zones, and identify potential leakage hot spots through extended period simulation (EPS) analyzing 24-hour demand patterns. Originally developed by US EPA's Water Supply and Water Resources Division, EPANET has become global standard for water distribution analysis with applications spanning network design, rehabilitation planning, water quality modeling, energy optimization, and critically for Indonesian utilities, systematic non-revenue water reduction through evidence-based intervention targeting achieving 15-30% loss reductions when properly calibrated and applied within comprehensive leakage management programs.
• Hydraulic Modeling Fundamentals and NRW Applications: EPANET employs conservation of mass and energy principles solving simultaneous equations describing flow through pipe networks, calculating pressure at each junction (node) and flow rate in each pipe (link) for steady-state or time-varying conditions. For NRW applications, this capability enables utilities to establish baseline hydraulic models calibrated against field measurements (pressure loggers, flow meters), simulate pressure reduction scenarios identifying optimal Pressure Reducing Valve (PRV) locations and setpoints achieving 20-40% leak flow rate reductions, design District Metered Areas (DMAs) with appropriate boundary valve configurations ensuring hydraulic independence while maintaining service reliability, predict impact of infrastructure rehabilitation comparing rehabilitation alternatives, and analyze minimum night flow patterns isolating leakage components from legitimate consumption establishing realistic reduction targets based on system-specific characteristics rather than generic benchmarks often inappropriate for local conditions.
• Model Development and Calibration Methodology: Successful EPANET application requires systematic model development process beginning with network data compilation from GIS databases, as-built drawings, and field surveys establishing accurate pipe inventory (length, diameter, material, installation date), customer demand allocation distributing consumption to appropriate nodes based on billing records or census data, boundary condition definition specifying source elevations and pump characteristics, followed by crucial calibration phase comparing model predictions against field measurements adjusting uncertain parameters (pipe roughness coefficients, demand patterns, minor loss factors) iteratively until model accuracy meets acceptance criteria typically ±5-10% for pressure predictions and ±10-15% for flow predictions. Indonesian utilities face particular calibration challenges from incomplete network documentation requiring extensive field verification, unmetered connections creating demand allocation uncertainty, and intermittent supply patterns complicating extended period simulation necessitating adaptive modeling approaches accounting for operational realities while maintaining sufficient accuracy supporting decision-making.
• Integration with Leak Detection and Pressure Management Programs: EPANET's true value emerges when integrated within comprehensive NRW reduction programs rather than standalone analysis, serving as platform for synthesizing diverse data sources (hydraulic monitoring, leak detection surveys, customer complaints, infrastructure condition assessments) into coherent strategic framework. Practical applications include pressure management zone design where EPANET identifies optimal PRV locations minimizing pressure while maintaining minimum service standards, DMA boundary optimization balancing zone size against hydraulic isolation requirements, rehabilitation prioritization comparing expected leakage reduction from alternative pipe replacement scenarios guiding capital investment allocation, operational optimization scheduling pump operations and tank levels minimizing energy costs while reducing pressure-driven leakage, and performance monitoring where ongoing model updates track system improvements validating intervention effectiveness and identifying emerging problem areas requiring attention demonstrating continuous improvement cycle essential for sustained NRW reduction beyond initial program enthusiasm.
Executive Summary
Water distribution network modeling represents essential technical capability for modern water utilities seeking to optimize infrastructure performance, reduce operational costs, and systematically address non-revenue water challenges that undermine financial sustainability and service delivery capacity. EPANET software, developed by the United States Environmental Protection Agency and released as public domain tool available without licensing fees, has emerged as dominant platform for distribution system analysis globally and increasingly within Indonesian water sector, offering sophisticated hydraulic and water quality modeling capabilities previously accessible only through expensive commercial software packages. The software's combination of technical rigor, user-friendly graphical interface, extensive documentation, and zero acquisition cost makes EPANET particularly appropriate for Indonesian PDAMs facing budget constraints while requiring advanced analytical tools supporting evidence-based infrastructure planning and NRW reduction program development.
The fundamental premise underlying EPANET application for NRW reduction recognizes that leakage behavior is hydraulically driven phenomenon where water loss rates depend critically on operating pressure throughout distribution network, with empirical relationships demonstrating that leak flow rates vary approximately with pressure raised to 0.5-1.1 power depending on pipe material flexibility and leak orifice characteristics. Consequently, systematic pressure reduction through optimized network design, appropriate valve installations, and operational protocol adjustments can achieve substantial leakage reductions without compromising customer service when implemented based on rigorous hydraulic analysis rather than trial-and-error approaches risking inadequate pressure or unintended consequences. EPANET enables utilities to predict pressure distributions resulting from various intervention scenarios before expensive field implementation, comparing alternatives, optimizing designs, and building confidence that proposed solutions will deliver expected benefits while maintaining service quality standards essential for customer satisfaction and regulatory compliance.
This comprehensive technical guide examines EPANET software and its systematic application for non-revenue water reduction in Indonesian municipal distribution systems through detailed analysis organized across eight integrated domains: software fundamentals and theoretical basis establishing hydraulic principles governing water distribution and computational methods EPANET employs solving network equations; model development methodology covering network schematization, data requirements, demand allocation, and boundary condition specification enabling accurate system representation; calibration techniques and validation procedures ensuring model predictions reliably reflect actual system behavior through systematic comparison with field measurements and parameter adjustment; pressure management applications utilizing EPANET for PRV sizing and placement, DMA design optimization, and pressure zone reconfiguration reducing leak-driving forces; leak detection integration where modeling supports survey planning, identifies anomalous flow patterns, and validates detection program effectiveness through quantified impact assessment; infrastructure rehabilitation analysis comparing alternative pipe replacement scenarios, prioritizing investments, and predicting long-term system evolution under various intervention strategies; operational optimization including pump scheduling, tank level management, and valve operation protocols minimizing energy consumption while controlling pressure-driven losses; and case study applications demonstrating successful EPANET deployment in Indonesian cities achieving measurable NRW reductions through model-guided intervention programs providing replicable templates for broader sector adoption.
EPANET Software Fundamentals and Theoretical Foundation
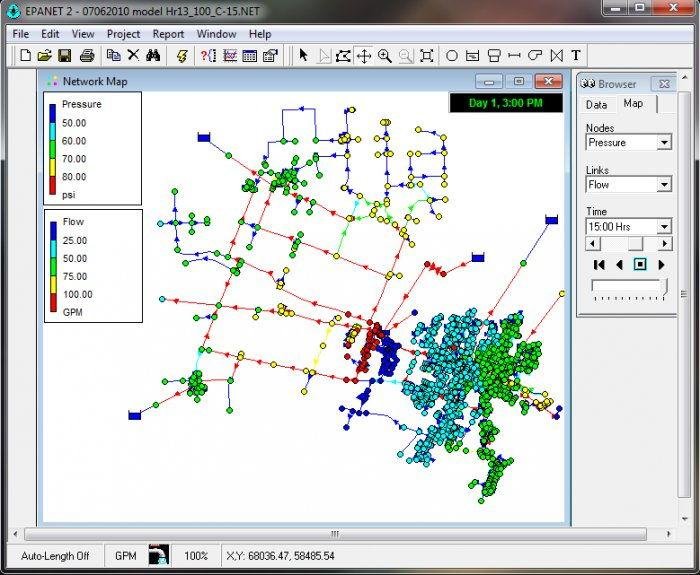
EPANET represents hydraulic modeling software developed specifically for water distribution network analysis, capable of performing extended period simulation tracking how water flows through pipe systems, how pressure varies at different locations, and how water quality changes over time as water moves from sources to consumers. The software models distribution systems as collections of links (pipes, pumps, valves) connecting nodes (junctions, tanks, reservoirs) where water enters the network at sources, flows through pipes driven by pressure differences, and is withdrawn at junction nodes representing customer demand. At its computational core, EPANET solves fundamental governing equations from fluid mechanics, conservation of mass requiring that flow into each junction equals flow out plus any withdrawal, and conservation of energy expressed through head loss relationships (Hazen-Williams, Darcy-Weisbach, or Chezy-Manning equations) describing pressure drop as water flows through pipes depending on flow rate, pipe diameter, length, and roughness characteristics.
The software employs sophisticated numerical algorithms solving the resulting system of non-linear equations simultaneously for entire network, determining pressure at every junction and flow in every pipe satisfying all constraints. For steady-state analysis representing constant demand conditions, EPANET uses gradient algorithm iteratively adjusting pressures and flows until solution converges meeting specified accuracy tolerances. For extended period simulation (EPS) analyzing time-varying demands over 24-hour cycles or longer periods, the software steps forward in time increments (typically 1 hour for daily patterns, shorter intervals for detailed operational analysis), solving hydraulic equations at each time step while tracking tank levels, pump operations, and control device status responding to changing conditions. This dynamic simulation capability proves particularly valuable for NRW analysis where leakage components dominate during low-demand night periods requiring time-based pressure management strategies optimized through EPS revealing how proposed interventions perform across entire demand cycle rather than single snapshot conditions potentially missing critical operational constraints or opportunities.
Figure 1: EPANET Network Components and Hydraulic Relationships
EPANET Network Object Types
Physical components represented in hydraulic model
Each object type has specific properties and behaviors
Combined to represent complete distribution system
NODE OBJECTS (Junction Points)
Junctions:
• Points where pipes connect
• Customer demand withdrawal locations
• Defined by: elevation, demand pattern, pressure limits
• EPANET calculates: pressure head, available pressure
Reservoirs:
• Fixed-head boundary conditions (constant pressure)
• Represent large sources (rivers, lakes, treatment plants)
• Infinite capacity assumption
• Supply elevation specified by user
Tanks (Storage):
• Variable water level during simulation
• Defined by: elevation, diameter, min/max levels
• EPANET tracks: level changes, inflow/outflow
• Critical for EPS and pressure management
LINK OBJECTS (Connections)
Pipes:
• Convey water between junctions
• Properties: length, diameter, material, roughness
• Head loss equations (Hazen-Williams, Darcy-Weisbach)
• EPANET calculates: flow rate, velocity, head loss
Pumps:
• Add energy to system (increase pressure)
• Defined by: pump curves, power rating, efficiency
• Can operate continuously or via controls
• Energy cost tracking for optimization
Valves:
• Control/regulate flow and pressure
• Types: PRV, PSV, FCV, TCV, GPV
• Essential for pressure management modeling
• Status can change during EPS
Fundamental Hydraulic Equations in EPANET
| Principle | Equation | Application in NRW Modeling |
|---|---|---|
| Conservation of Mass (Continuity) | Σ Qin - Σ Qout - Qdemand = 0 At each junction, flows balance |
Enables demand allocation including leakage component as pseudo-demand at nodes, ensuring water balance closure in model matching system input volume |
| Energy Conservation (Head Loss) | Hazen-Williams: hL = 10.67 × L × Q1.852 / (C1.852 × D4.87) Darcy-Weisbach: hL = f × (L/D) × (V²/2g) |
Calculates pressure drop in pipes enabling pressure distribution prediction, critical for identifying high-pressure zones requiring PRV installation or low-pressure areas limiting service |
| Pressure-Leakage Relationship | Qleak = C × PN1 Where N1 = 0.5 (fixed orifice) to 1.5 (flexible pipe) Typical N1 = 1.0-1.15 for distribution mains |
External to EPANET but applied in analysis: predicts leakage flow change resulting from pressure reduction interventions, quantifies expected NRW improvement from pressure management |
| Minimum Night Flow (MNF) | MNF = Legitimate Night Use + Leakage MNF typically occurs 02:00-04:00 AM Leakage ≈ MNF - (0.10 to 0.15) × Average Daily Flow |
EPANET simulates MNF period with night demand pattern, enabling comparison of modeled vs measured MNF validating leakage allocation and identifying discrepancies indicating model errors or unknown leaks |
Head Loss Equation Selection for Indonesian Networks
- Hazen-Williams (recommended for most applications): Simpler empirical formula widely used globally, C-factor values well-established for common pipe materials (PVC: 130-150, AC: 100-140 depending on age/condition, GI: 100-130), adequate accuracy for pressure-driven analysis, computationally efficient enabling large network models
- Darcy-Weisbach (for detailed analysis): Theoretically rigorous based on fluid mechanics principles, requires friction factor (f) determined from Reynolds number and relative roughness, more accurate for extreme conditions (very high/low velocities, unusual fluids), computationally intensive, useful for research applications or validation
- Practical approach: Use Hazen-Williams for routine modeling, calibrate C-factors to match field pressures, reserve Darcy-Weisbach for special studies requiring highest accuracy or when Hazen-Williams proves inadequate (rare in typical municipal distribution applications)
Critical Insight: EPANET's power for NRW applications stems not from mathematical complexity but from ability to synthesize diverse data (network geometry, demand patterns, operational rules, infrastructure characteristics) into coherent framework enabling "what-if" scenario analysis comparing intervention alternatives before field implementation. Model accuracy depends critically on data quality and calibration rigor rather than equation sophistication, garbage in, garbage out principle applies forcefully requiring investment in field measurement programs and systematic calibration procedures discussed in subsequent sections.
Table 1: EPANET Capabilities Relevant to NRW Reduction Programs
| EPANET Function | Technical Description | NRW Application | Practical Example |
|---|---|---|---|
| Steady-State Hydraulic Analysis | Solves network equations for single demand condition (e.g., average day, peak hour, minimum night flow), calculates pressures and flows assuming constant conditions | Identify zones with excessive pressure (>60-70 m head) indicating PRV opportunities, locate low-pressure areas (<15-20 m) requiring capacity upgrades before pressure reduction feasible | Model peak hour demand scenario revealing that Zone A experiences 75-85 m pressure, 30-40 m above minimum requirement, suggesting PRV installation could reduce pressure 40% without service impact |
| Extended Period Simulation (EPS) | Time-based analysis stepping through 24-hour or multi-day periods, tracks changing demands, tank levels, pump operations, valve status responding to time patterns and control rules | Design time-modulated pressure management where PRV setpoints vary by hour (higher daytime, lower nighttime), verify adequate pressure maintained throughout entire demand cycle, optimize pump schedules minimizing nighttime pressure spikes | EPS reveals overnight tank filling causes pressure surge 02:00-05:00 coinciding with MNF period when leakage dominates, implementing time-based controls reduces night pressure 25% saving estimated 8-12% total system input volume |
| Pressure Reducing Valve Modeling | Simulates PRV operation maintaining specified downstream pressure setpoint, automatically calculates required head loss across valve, handles valve opening/closing based on flow direction and pressure conditions | Test alternative PRV locations comparing effectiveness for pressure reduction, size PRVs based on required flow capacity, design cascaded PRV systems for complex topography, verify no unintended consequences (e.g., downstream starvation) | Comparing 3 alternative PRV placements, model shows Location B provides 20% greater pressure reduction than alternatives while maintaining >25 m minimum pressure at all critical points, justifying selection for implementation |
| Network Reconfiguration Analysis | Modify network topology closing/opening valves, adding/removing pipes or tanks, compare system performance under different configurations identifying optimal layout for objectives (pressure control, reliability, cost) | Design DMA boundaries testing alternative valve closure patterns balancing hydraulic independence against service reliability, evaluate bypass requirements for emergency situations, optimize tank operations supporting pressure management objectives | DMA boundary design closing 8 valves creates isolated zone, but model reveals emergency scenario (main break on inlet pipe) leaves 2,000 customers without service; adding single bypass connection resolves vulnerability at 15% of customers while preserving 90% of pressure management benefit |
| Demand Allocation and Variation | Distribute total system demand to individual junctions based on customer locations, assign time patterns defining hourly variation factors, differentiate demand categories (residential, commercial, industrial, leakage) | Allocate estimated leakage as pressure-dependent demand at nodes proportional to pipe length or past leak history, model background leakage vs. burst leakage with different patterns, quantify impact of leak repairs on system hydraulics | Allocating 30% system leakage proportionally to pipe length creates 450 leak nodes with pressure-dependent demand (using emitter coefficient), enables prediction that 40% pressure reduction yields 28-32% leakage flow reduction matching empirical N1=1.15 exponent |
| Calibration and Parameter Adjustment | Systematic comparison of model predictions vs field measurements, adjust uncertain parameters (pipe roughness, demand magnitudes/patterns, minor losses) until model accurately reproduces observed system behavior | Install temporary pressure loggers and flow meters throughout network collecting 7-14 day datasets, calibrate model achieving ±5-10% pressure prediction accuracy, validate MNF predictions confirming leakage allocation realistic, build confidence in model for decision support | Initial model predicts 45-50 m pressure at Junction 247, field logger measures 38-42 m, investigation reveals unmapped PRV upstream requiring addition to model; after correction, model accuracy improves achieving <8% error across 25 monitoring points enabling reliable intervention analysis |
| Scenario Comparison and Optimization | Run multiple scenarios systematically varying parameters or configurations, compare results identifying optimal solutions, perform sensitivity analysis testing how uncertainties affect conclusions, support cost-benefit analysis of alternatives | Compare rehabilitation alternatives (pipe replacement vs. PRV installation vs. network reconfiguration), quantify expected NRW reduction for each option, calculate cost per m³ water saved, rank interventions by economic return informing capital budget allocation | Comparing 4 intervention scenarios: (1) do nothing, (2) install 3 PRVs (cost IDR 45 million, 12% NRW reduction), (3) replace 2 km worst pipes (cost IDR 6 billion, 8% reduction), (4) combined approach (cost IDR 6.05 billion, 18% reduction); BCR analysis favors option 4 with 2.4:1 ratio vs 1.6:1 for option 3 alone |
| Energy and Cost Analysis | Calculate pumping energy consumption based on flow, head, efficiency, and operating duration, assign electricity tariffs, total energy costs, identify opportunities for energy savings through operational changes or infrastructure modifications | Quantify energy savings from NRW reduction (less water pumped/treated), optimize pump schedules balancing energy costs against pressure management for leakage control, demonstrate financial benefits beyond water savings alone enhancing business case for NRW investments | Model shows 20% NRW reduction decreases system input volume 30,000 m³/day, reducing annual pumping energy 2.2 million kWh worth IDR 2.4 billion at Indonesian electricity rates, energy savings alone justify 65% of total NRW program cost improving project economics |
EPANET's open-source nature and extensive user community provide additional advantages beyond core functionality: free availability eliminates software acquisition costs significant for budget-constrained Indonesian utilities; active user forums and extensive documentation support self-directed learning and problem-solving; third-party tools and extensions (EPANET-MSX for water quality, EPANETrtx for real-time analysis, various GIS integration add-ons) expand capabilities; and platform independence (Windows, Linux, Mac) ensures accessibility across different computing environments avoiding vendor lock-in common with commercial alternatives.
Model Development Methodology: From Data to Calibrated Network Representation
Developing functional EPANET model requires systematic workflow transforming raw infrastructure data, operational information, and field measurements into accurate digital representation of distribution network capable of predicting system behavior with sufficient reliability supporting engineering decisions. The process begins with network schematization where physical infrastructure (pipes, valves, pumps, tanks, customers) is translated into EPANET's node-link paradigm, necessarily involving simplification decisions balancing model detail against data availability, computational requirements, and intended applications. For NRW-focused models, appropriate schematization emphasizes transmission and primary distribution mains (typically ≥100-150mm diameter) carrying most flow and experiencing significant head losses, while secondary distribution and service connections may be represented through aggregated demands at junction nodes rather than explicit pipe-by-pipe modeling reducing model complexity without sacrificing accuracy for pressure distribution prediction, the critical output for leak analysis.
Indonesian utilities face particular data challenges during model development stemming from historical documentation gaps where as-built drawings are incomplete, missing, or inaccurate requiring extensive field verification; legacy systems installed over decades with inconsistent record-keeping creating uncertainty about pipe materials, diameters, and routing; unrecorded modifications during maintenance or development activities where network configuration diverges from available maps; and GIS database limitations where spatial data exists but lacks essential attributes (installation dates, pipe materials, valve sizes) necessitating supplementation from field surveys or engineering judgment. Addressing these gaps requires pragmatic approach recognizing perfect information is unattainable while sufficient accuracy remains achievable through strategic field verification focusing on critical infrastructure (large mains, key valves, major customers), assumption documentation clearly stating what is known vs. inferred enabling future updates as better information becomes available, and validation emphasis where model calibration against field measurements ultimately determines adequacy regardless of input data uncertainties, if model predictions match observations, underlying assumptions are functionally adequate even if not precisely correct.
Systematic EPANET Model Development Protocol for Indonesian Water Utilities
Phase 1: Data Compilation and Network Schematization
Step 1.1: Infrastructure Inventory Development
- GIS database extraction: Export existing spatial data (pipes, valves, nodes) from utility GIS if available, verify completeness comparing against service area coverage and customer locations, identify gaps requiring field verification or engineering estimation
- As-built drawing compilation: Collect available construction documents, scan and georeference paper records if digital versions unavailable, create unified spatial reference system (typically WGS84 or local UTM zone) ensuring coordinate consistency
- Pipe inventory prioritization: For large networks where complete inventory overwhelming, adopt tiered approach: Tier 1 (transmission mains ≥300mm, 100% inclusion required), Tier 2 (primary distribution 150-300mm, ≥90% coverage target), Tier 3 (secondary distribution 100-150mm, representative sampling acceptable), Tier 4 (<100mm, aggregate representation via demand allocation rather than explicit pipes)
- Critical infrastructure focus: Ensure accurate representation of pressure zones, PRVs, major valves, pumping stations, storage tanks, and large customer connections (industrial, commercial) where errors significantly impact model accuracy
- Field verification protocol: For high-priority pipes lacking documentation, conduct targeted field surveys using pipe locators, excavation test pits at strategic locations (major intersections, known valve chambers) confirming size, material, depth, and connectivity
Step 1.2: Demand Allocation and Pattern Assignment
- Base demand calculation: Extract total billed consumption from billing database (m³/month), convert to average daily demand (m³/day and L/second), add unbilled authorized consumption (estimated from operational records), yields total authorized consumption for allocation
- Spatial distribution methodology: Allocate demands to junction nodes based on customer locations, ideal approach assigns each customer/meter to nearest junction weighted by consumption; practical approach for dense residential areas distributes demand proportionally to pipe length or residential area coverage
- Customer category differentiation: Separate residential, commercial, industrial, public/institutional demands enabling different diurnal patterns assignment (residential peak morning/evening, commercial peak daytime, industrial relatively constant, public following specific facility operations)
- Leakage allocation strategy: For NRW modeling, allocate estimated physical losses (from water balance calculation) to nodes as additional "demand" representing leakage, distribution options include: proportional to pipe length (assumes leakage density uniform), proportional to historical leak repair locations (concentrates leakage where past problems occurred), or pressure-dependent using emitter coefficients (advanced approach modeling leak flow varying with pressure)
- Diurnal pattern development: Analyze flow meter data from DMAs or master meters extracting 24-hour pattern showing hourly variation factors (multipliers of base demand), typical Indonesian patterns show double peaks (morning 06:00-08:00, evening 18:00-20:00) for residential with MNF occurring 02:00-04:00, assign patterns by customer category and apply uniformly to nodes of each type
Step 1.3: Boundary Condition and Operational Data Specification
- Source definition: Identify all water sources (treatment plants, groundwater wells, bulk purchase points), represent as reservoirs with fixed head (elevation of water surface at source) or tanks with defined geometry enabling level variation during EPS
- Storage tank characterization: Survey all elevated tanks and ground-level reservoirs measuring: base elevation (ground level for elevated tanks, bottom elevation for ground tanks), minimum/maximum operational levels (overflow elevation, low-level alarm), tank diameter or geometry (for volume calculation), typical operating patterns (fill/draw cycles)
- Pump station data: Compile pump curves (head vs. flow relationships) from manufacturer data or field testing, record operational settings (on/off levels for level-controlled pumps, time schedules for timer-controlled operations, pressure setpoints for pressure-controlled systems), estimate pump efficiency and power consumption for energy analysis
- Valve inventory: Locate and characterize all control valves particularly PRVs (downstream pressure setpoint, valve size), flow control valves (flow setpoint or fully-open roughness), and isolation valves (normally open/closed status), verify operational status through field inspection as valve position often differs from records due to undocumented operational changes
- Control rules specification: Document operational protocols controlling pumps (e.g., "Pump 1 ON when Tank A level <3m, OFF when level >8m"), valves (time-based PRV setpoint changes for pressure management), and other active controls, translate into EPANET control language or simple controls enabling automatic operation during EPS
Phase 2: Model Construction and Initial Setup
Step 2.1: Network Schematization in EPANET Interface
- Import base map: Load georeferenced map or satellite imagery as background providing spatial reference for network construction, alternatively import node coordinates from GIS exporting to EPANET-compatible format (CSV, shapefile via third-party tools)
- Junction placement: Create junction nodes at pipe intersections, pipe endpoints, significant elevation changes, customer connection clusters, valve locations, ensuring adequate density capturing network topology while avoiding excessive detail (target: 50-200 junctions per km² in dense urban areas, fewer in low-density zones)
- Pipe connectivity: Draw pipes connecting junctions following actual network routing, assign properties: length (measured from map or GIS), diameter (from inventory data), material (determines roughness coefficient), note EPANET requires elevation for each junction typically extracted from digital elevation model (DEM) or surveyed ground levels
- Source and tank addition: Place reservoir objects at all sources specifying total head (elevation + atmospheric pressure), add tank objects with geometry and level data, connect to network via pipes or pumps as appropriate matching actual system configuration
- Pump and valve installation: Insert pump links between junctions representing pump stations, assign pump curves, add valve links (PRV, PSV, FCV, etc.) at documented locations with specified settings, verify proper connectivity ensuring valves orient correctly (downstream side for PRVs)
Step 2.2: Property Assignment and Initial Parameter Selection
- Pipe roughness (C-factors for Hazen-Williams): Assign initial values based on material and age: new PVC = 140-150, aged PVC (10-20 years) = 130-140, asbestos cement new = 130-140, AC aged = 100-120, galvanized iron new = 120-130, GI aged = 80-110, cast iron unlined = 80-120 depending on corrosion severity, note these are starting points requiring calibration adjustment
- Demand allocation to junctions: Import demand data assigning base demand (L/second or m³/hour) to each junction, link to appropriate diurnal pattern (residential, commercial, etc.), verify total network demand matches system input volume from water balance (production - exports + imports)
- Pressure limits specification: Set minimum required pressure at junctions (typically 15-20 m for residential areas, higher for multi-story buildings or industrial processes), maximum allowable pressure (typically 60-80 m above which excessive leakage and pipe stress occur), EPANET will flag violations during analysis aiding problem identification
- Time step and duration: For steady-state analysis, single snapshot sufficient; for EPS, set hydraulic time step (1 hour typical, shorter for detailed operational analysis), pattern time step (matching pattern data, usually 1 hour), simulation duration (24 hours minimum, 48-72 hours for systems with slow tank cycling), reporting time step (determines output frequency)
Phase 3: Model Validation and Quality Assurance Checks
- Mass balance verification: Run initial simulation checking that total demand (consumption + leakage) equals total source inflow ±1-2%, significant discrepancy indicates demand allocation error or missing/duplicate junctions requiring correction
- Pressure range review: Examine pressure distribution across network, verify reasonable values (20-80 m typical, extreme values <0 or >150 m suggest elevation errors, excessive head loss, or disconnected network segments), generate pressure contour map identifying high/low pressure zones
- Flow velocity check: Review velocities in pipes, typical range 0.3-3.0 m/second (below 0.2 m/s suggests oversizing or low demand, above 3.5 m/s indicates undersizing or excessive demand risking water hammer), extreme values flag data errors requiring investigation
- Connectivity verification: Ensure all junctions connected to source (no isolated segments unless intentional), verify valve orientations correct (PRV reduces pressure, check valve prevents backflow), confirm pump head gain positive and reasonable (<150 m typical for distribution booster pumps)
- Pattern and control testing: Run 24-hour EPS verifying demand patterns apply correctly (peak factors ~1.5-2.0 typical, MNF factors 0.2-0.4), check control operations execute as intended (pumps cycle appropriately, PRVs maintain setpoints, tanks fill and draw), adjust controls if behavior unrealistic
- Documentation preparation: Record all assumptions, data sources, parameter selections, and known limitations creating audit trail supporting future model updates and enabling other users to understand model basis and appropriate applications
Table 2: Typical Data Requirements for EPANET Model Development - Indonesian PDAM Context
| Data Category | Required Information | Typical Sources (Indonesian Context) | Data Quality Challenges & Solutions |
|---|---|---|---|
| Pipe Network Geometry | Pipe locations, lengths, diameters, materials, installation dates, connectivity, elevations at nodes | GIS database (if available), as-built drawings (often paper archives), Google Earth/satellite imagery for verification, field surveys for critical mains | Challenge: Documentation gaps for 30-60% of network in typical PDAM Solution: Prioritize large mains (≥150mm) for verification, estimate secondary pipes using standard layouts, validate via pressure calibration |
| Customer Demand Data | Billed consumption by customer, customer locations (coordinates), customer types (residential/commercial/industrial), connection counts | Billing database (Oracle, SAP, custom systems), customer registration records, GIS customer layer if available, census data for unmetered estimates | Challenge: Customer geocoding often missing or inaccurate Solution: Aggregate demand to areas/blocks rather than individual addresses, allocate proportionally to pipe length in residential zones, ground-truth for major customers |
| Diurnal Demand Patterns | Hourly variation of demand over 24-hour cycle, separate patterns for residential, commercial, industrial, public uses, seasonal variations if significant | DMA flow meters (if installed), production meters with hourly recording, SCADA data from pumping stations, temporary data loggers for pattern development | Challenge: Limited metering with high-frequency data Solution: Install temporary loggers (2-4 week campaign), borrow patterns from similar utilities, use generic residential patterns as starting point, refine during calibration |
| Source and Tank Data | Treatment plant elevations/capacities, groundwater well yields/levels, tank dimensions/operating levels/elevations, reservoir volumes | Facility design documents, SCADA systems (if available), field measurements using surveying equipment or GPS, operational logs recording levels/flows | Challenge: Tank geometry documentation sometimes incomplete Solution: Direct measurement of tank dimensions, calculate volume from fill time and known inflow, estimate from architectural drawings if construction details unavailable |
| Pump Characteristics | Pump curves (head vs. flow), operating points, control settings (on/off levels, schedules), efficiency curves, power ratings | Manufacturer data sheets (if available), commissioning test reports, field testing (measure flow, suction/discharge pressures at multiple operating points), SCADA operating records | Challenge: Pump curves often lost, performance degraded from nameplate Solution: Field test pumps measuring actual performance, use standard curves for pump type/size as approximation, verify via operational data (tank fill rates) |
| Valve Locations and Settings | PRV locations, setpoints, sizes; isolation valve positions; check valve orientations; FCV/PSV/TCV specifications if present | Valve maintenance records, GIS valve layer, field inspection verifying actual installation vs. design, pressure monitoring data inferring PRV locations/setpoints from observed pressure steps | Challenge: Undocumented valve changes during operations, unknown setpoints on older PRVs Solution: Systematic field survey of critical valves, pressure monitoring upstream/downstream inferring setpoints, update GIS with confirmed locations |
| Elevation Data | Ground elevations at junctions, topographic map of service area, critical point elevations (hilltops, low areas), source/tank elevations accurate to ±0.5-1.0 m | Digital Elevation Model (DEM) from SRTM or local surveys (30m or better resolution), Google Earth elevation tool, field surveys with GPS or leveling for critical points | Challenge: DEM resolution insufficient for local variations in flat areas Solution: Use best available DEM for general topology, field-verify elevations at critical points (tanks, high/low pressure zones), interpolate where necessary |
| Operational Data for Calibration | Pressure measurements at multiple locations, flow measurements at DMAs or key points, tank level variations, pump operating schedules, customer pressure complaints | Temporary pressure logger deployment (2-4 weeks at 10-20 locations), existing SCADA data, field pressure surveys (static and dynamic), customer complaint database analysis | Challenge: Limited existing monitoring infrastructure Solution: Invest in temporary logging campaign (IDR 50-200 million for equipment rental/deployment), target strategically: zone boundaries, critical points, complaint areas, high/low elevations |
Realistic assessment of data quality and availability essential for successful model development, perfectionism paralyzes progress while pragmatism enables useful models despite imperfect data. Indonesian utilities should adopt iterative approach: develop initial model using available data accepting uncertainties, calibrate against field measurements improving confidence, apply model for initial decisions building organizational experience, progressively improve data quality through ongoing field verification and monitoring investment, and update model periodically incorporating new information, this evolutionary approach delivers value throughout journey rather than waiting for perfect dataset that may never materialize.
Model Calibration and Validation: Ensuring Predictive Reliability
Model calibration represents critical phase transforming initial network schematization into validated predictive tool through systematic comparison of model outputs against field measurements, identifying and adjusting uncertain parameters until model accuracy meets defined acceptance criteria supporting confident application for NRW analysis and infrastructure planning. The calibration process fundamentally addresses reality that many model inputs involve significant uncertainty, pipe roughness coefficients vary unpredictably depending on actual pipe condition unknown without internal inspection, demand allocations rely on imperfect spatial distribution assumptions, minor losses at fittings and appurtenances are difficult to quantify precisely, and operational practices may differ from documented procedures requiring empirical validation. Calibration compensates for these uncertainties by adjusting parameters within reasonable bounds until model reproduces observed system behavior, effectively "tuning" the model to match reality even if individual parameter values remain somewhat uncertain.
Effective calibration requires comprehensive field measurement campaign providing reference data against which model predictions are compared, typically involving pressure monitoring at 10-30 locations distributed throughout network capturing range of elevations, distances from sources, demand densities, and infrastructure conditions, with continuous recording over 7-14 day period capturing daily and weekly demand variations. Flow measurements at key locations, DMA inlets, master meters, critical mains, provide additional validation data particularly valuable for confirming demand allocations and identifying unmodeled water losses. For Indonesian utilities, the measurement campaign represents modest investment (equipment rental IDR 30-100 million, labor for installation/retrieval/data processing IDR 20-50 million) delivering substantial returns through improved model confidence enabling millions to billions rupiah infrastructure decisions to be made on sound technical basis rather than guesswork or historical precedent potentially inappropriate for current conditions.
Systematic Model Calibration Protocol and Acceptance Criteria
Calibration Workflow and Parameter Adjustment Strategy:
| Calibration Step | Methodology | Parameter Adjustment Guidelines | Success Indicators |
|---|---|---|---|
| 1. Gross Error Detection | Run initial simulation, identify extreme discrepancies (>30-50% error) suggesting data errors rather than calibration issues, investigate and correct before fine-tuning | Common errors: • Elevation errors (wrong sign, decimal errors) • Diameter errors (mm vs inches confusion) • Missing/closed valves • Disconnected network segments • Demand allocation errors (order of magnitude) |
Pressure predictions within ±30% of measurements at majority of points, no negative pressures or extreme velocities (>5 m/s), mass balance closes to ±5% |
| 2. Source/Tank Level Matching | For tanks, compare predicted level variation with observed SCADA data or manual readings, adjust inflows, outflows, or tank geometry until patterns match reasonably | Adjustments: • Verify tank diameter/geometry • Confirm pump controls (on/off levels) • Check demand allocation in tank service area • Validate pump curves and efficiency |
Tank level predictions ±0.5-1.0 m of observed levels, fill/draw cycles match timing ±1-2 hours, minimum/maximum levels achieved in simulation match observed operations |
| 3. System-Wide Demand Validation | Compare total model demand (sum of all junction demands) against measured system input volume from production meters, adjust demand magnitudes proportionally if significant discrepancy | Adjustments: • Scale all demands by correction factor • Verify leakage allocation matches NRW estimate • Check for major customers missing in model • Confirm pattern peak factors reasonable (1.5-2.5 typical) |
Model total demand matches measured SIV ±3-5%, minimum night flow prediction matches observed MNF ±10-15%, peak hour flow prediction reasonable (~200-250 L/connection/day for residential) |
| 4. Pressure Calibration (Primary Focus) | Systematically adjust pipe roughness coefficients (C-factors) comparing predicted vs measured pressures, iterate until acceptable accuracy achieved, typically requires 3-10 adjustment cycles | C-factor adjustment strategy: • Group pipes by age and material • Adjust groups rather than individual pipes • If pressures too high: decrease C-factors (increases head loss), range: reduce by 10-30% • If pressures too low: increase C-factors (decreases head loss), range: increase by 10-30% • Respect physical limits: C=80-100 minimum (very rough old pipes), C=150 maximum (new smooth pipes) |
Target accuracy: • ≥80% of monitoring points within ±5-10% error • ≥95% within ±15% error • No systematic bias (under/over prediction) • Reasonable C-factors (within expected ranges for materials/ages) |
| 5. Flow Calibration (If Data Available) | Compare predicted flows at DMA meters or other measurement points with observed values, provides validation of demand allocation and network connectivity | Adjustments: • Redistribute demands within zones if flow errors large • Verify valve status (open/closed) affecting flow distribution • Check for unmapped pipes creating unmodeled flow paths |
Flow predictions within ±10-20% of measurements, directionality correct (flows toward expected areas), zone water balances match (inflows ≈ demands for isolated zones) |
| 6. Time-Based Validation (EPS) | For extended period simulation, compare 24-hour pressure traces at logger locations with model predictions, verify diurnal patterns match, assess peak/off-peak accuracy separately | Pattern refinement: • Adjust peak factors if timing mismatches • Modify pattern shape for better fit • Separate patterns for different zones if needed • Validate night-time pressures critical for leakage analysis |
Pressure traces follow similar shapes to observations, peak pressures within ±10% of observed peaks, MNF period pressures within ±5-8% (critical for leakage modeling) |
| 7. Sensitivity Analysis | Test how model outputs change with parameter variations, identify which parameters most influence results requiring careful specification vs. which have minimal impact allowing less precision | Key sensitivities: • C-factors: usually sensitive requiring calibration • Major pipe diameters: very sensitive, verify carefully • Elevations: moderately sensitive in hilly terrain • Demand magnitudes: sensitive to total, less to distribution • Minor losses: usually low sensitivity unless severe restriction |
Understand which parameters matter most for intended applications, focus data collection and calibration effort accordingly, document sensitivity findings guiding appropriate model use and confidence levels |
Calibration Best Practices for Indonesian Context
- Prioritize pressure calibration: For NRW applications, accurate pressure prediction most critical as leakage depends on pressure; flow calibration secondary if pressure accuracy good, focus effort where most impact
- Accept "good enough" rather than perfection: Model achieving ±10% pressure accuracy highly useful supporting engineering decisions; pursuing ±2% accuracy requires disproportionate effort with minimal added value for typical applications, diminishing returns apply
- Document calibration basis: Record calibration dataset (dates, locations, conditions), final parameter values adopted, accuracy achieved, and known limitations guiding future users on appropriate model applications and confidence levels
- Periodic recalibration: As network changes (new pipes, PRV installations, demand growth), model requires updating; establish procedure for incorporating infrastructure changes and periodic validation (annual or biennial) maintaining model currency and reliability
- Use calibration to identify problems: Large calibration discrepancies often reveal actual system problems (unmapped infrastructure, valve operations errors, leakage concentrated in areas) rather than just model deficiencies, investigate anomalies for operational insights beyond model improvement alone
Calibration Reality Check: Perfectly calibrated model is unattainable myth real systems have uncertainties, measurements have errors, conditions vary daily. Goal is "sufficiently accurate model" where predictions reliable enough supporting confident decisions for intended applications. Indonesian utilities should target ±10% pressure accuracy as excellent performance enabling robust NRW analysis, rehabilitation planning, and operational optimization without chasing unrealistic perfectionism that delays practical applications and wastes resources on marginal accuracy improvements delivering no decision-making value.
EPANET Applications for Pressure Management and DMA Design
Pressure management represents highest-return NRW intervention for most Indonesian utilities, capable of achieving 15-30% leakage reduction through relatively modest infrastructure investments (PRV installations typically USD 2,000-15,000 each) compared to expensive pipe replacement programs, with benefits realized immediately upon implementation rather than multi-year rollouts required for comprehensive rehabilitation. EPANET enables systematic pressure management design through predictive analysis identifying optimal PRV locations, determining appropriate pressure setpoints balancing leakage reduction against service quality maintenance, and evaluating alternative strategies (fixed vs time-modulated vs flow-modulated PRV control, single vs cascaded PRV installations, network reconfiguration options) before costly field implementation. The software's ability to simulate pressure distributions throughout network under various operational scenarios proves invaluable for Indonesian utilities where topographic variations create natural pressure zones, historical infrastructure designed for higher pressures than currently necessary given modern fixtures and customer expectations, and intermittent supply patterns complicate pressure management requiring careful analysis ensuring 24-hour supply areas receive adequate pressure while minimizing waste through excessive pressure during low-demand periods.
District Metered Area design likewise benefits substantially from EPANET modeling enabling evaluation of alternative DMA boundary configurations, assessment of hydraulic impacts from valve closures creating zone isolation, and verification that minimum pressure standards maintained within DMAs under all demand conditions including fire flow emergencies requiring temporary high withdrawals. Indonesian utilities implementing DMA programs face particular design challenges including dense urban networks where creating hydraulic isolation without compromising service reliability requires careful valve placement analysis; looped systems providing redundancy where DMA boundaries must balance isolation against emergency supply paths; and mixed topography where single DMA may include significant elevation variation creating internal pressure differentials requiring sub-zone consideration or cascaded PRV installations within larger DMAs. EPANET modeling addresses these complexities through systematic "what-if" analysis comparing dozens of alternative DMA configurations identifying optimal solutions maximizing hydraulic independence (facilitating accurate water balance and leakage quantification) while maintaining service reliability and operational flexibility essential for sustainable implementation beyond initial program enthusiasm period.
Decision Framework: EPANET-Based Pressure Management Design Process
Pressure Management Design Workflow Using EPANET
Systematic process from baseline assessment to optimized implementation
Combines hydraulic analysis with economic evaluation and operational feasibility
Adaptable to Indonesian utility constraints and priorities
| Stage | EPANET Analysis Tasks | Key Outputs and Deliverables | Decision Criteria and Validation |
|---|---|---|---|
| Stage 1: Baseline Assessment |
• Run calibrated model for average day and peak hour conditions • Generate pressure contour maps • Identify zones with excessive pressure (>50-60 m head) • Locate critical points (minimum pressure locations) • Analyze pressure variation across elevation zones |
• Network-wide pressure distribution map • High-pressure zone identification (candidates for PRV intervention) • Minimum pressure inventory (constraints for pressure reduction) • Pressure statistics (mean, range, exceedance frequencies) |
Screening criteria: • Zones averaging >50 m pressure = high priority • >30% of zone exceeding 60 m = urgent intervention • Minimum pressure >25-30 m = headroom for reduction • Large pressure variation (range >40 m) = reconfiguration opportunity |
| Stage 2: Intervention Scenario Development |
• Identify potential PRV locations (zone boundaries, pressure breaks, topographic steps) • Test alternative PRV placements in model • Develop 3-5 intervention scenarios varying PRV count, locations, setpoints • Include time-modulated and flow-modulated options • Analyze network reconfiguration alternatives |
• PRV location alternatives (typically 2-4 options per zone) • Pressure reduction maps for each scenario • Flow requirements for PRV sizing • Comparative analysis matrix • Preliminary cost estimates (PRV equipment + installation) |
Comparison metrics: • Average pressure reduction achieved • Percentage of zone achieving target pressure • Capital cost per meter pressure reduction • Operational complexity (# of PRVs to maintain) • Service reliability impact |
| Stage 3: Detailed Hydraulic Design |
• Model selected PRV scenario in detail • Optimize PRV setpoints (iterate to find best balance) • Verify minimum pressure ≥target at all junctions • Test emergency scenarios (main breaks, valve closures, fire flow) • Conduct EPS for time-based control design • Validate against seasonal demand variations |
• Final PRV specifications (location, size, setpoint, control type) • Pressure distribution maps (before/after comparison) • Emergency scenario analysis results • Time-based control schedule if applicable • Expected pressure reduction statistics |
Design validation: • Min pressure ≥20-25 m (residential) under all conditions • Peak hour pressure ≥30 m (multi-story areas) • Fire flow (10-15 L/s additional) maintains ≥15 m • PRV sized for max flow +30% margin • No reverse flow or PRV oscillation issues |
| Stage 4: NRW Impact Quantification |
• Apply pressure-leakage relationship (Qleak ∝ PN1) • Calculate pressure reduction at all leak-prone areas • Estimate leakage flow reduction using calibrated N1 exponent (typically 1.0-1.15 for Indonesian systems) • Aggregate zone-wide leakage savings • Project to annual water volume and cost savings |
• Predicted leakage reduction (% and absolute volume) • Expected NRW improvement (percentage points) • Annual water savings (m³/year) • Financial benefits (production cost savings + revenue recovery potential) • Payback period and BCR calculation |
Economic viability: • Leakage reduction ≥15-20% to justify investment • BCR >1.5-2.0 (benefits exceed costs with margin) • Payback <3-5 years (capital recovery period) • NPV positive over 10-15 year asset life • Alignment with NRW reduction targets |
| Stage 5: Implementation Planning |
• Develop phased implementation sequence • Model commissioning procedure (gradual setpoint reduction) • Design monitoring plan (pressure logger placement for validation) • Prepare operational procedures and maintenance protocols • Conduct operator training on PRV operation |
• Implementation schedule (PRV installation sequence) • Commissioning protocol (startup procedures) • Monitoring and evaluation plan • Operator training materials • Maintenance schedule and spare parts inventory |
Implementation readiness: • Complete technical specifications for procurement • Clear installation drawings and procedures • Customer communication plan addressing concerns • Contingency plans for service disruptions • Performance monitoring framework established |
| Stage 6: Post-Implementation Validation |
• Update model with actual PRV installations • Calibrate against post-implementation pressure data • Compare predicted vs achieved pressure reductions • Validate leakage reduction estimates against measured flow reductions • Identify any unintended consequences or performance gaps |
• Performance validation report • Actual vs predicted comparison • Lessons learned documentation • Model updates incorporating as-built conditions • Recommendations for optimization or corrective actions |
Success metrics: • Achieved pressure reduction ≥80% of predicted • No customer complaints regarding low pressure • Measured NRW reduction ≥70% of estimate • PRVs functioning reliably without failures • Model accuracy validated (building confidence for future applications) |
Example Pressure Management Design Case
Situation: PDAM Zone serving 12,000 connections in hilly terrain, baseline pressures ranging 35-85 m head, high NRW 38%, leakage estimated 26% of SIV
EPANET Analysis: Model reveals 60% of zone experiences >55 m pressure, critical point (highest elevation) at 32 m minimum. Testing 4 PRV scenarios: (1) single PRV at zone inlet reducing to 45 m, (2) dual PRVs creating two sub-zones at 42 and 48 m, (3) single time-modulated PRV (50 m day, 38 m night), (4) flow-modulated PRV varying 38-50 m based on demand
Results: Option 3 (time-modulated) provides best performance: 30% pressure reduction during night (MNF period when leakage dominates), 18% daytime reduction, maintains ≥25 m minimum all conditions, predicted leakage reduction 22% (5.7% NRW improvement), cost IDR 65 million vs IDR 95 million for option 4, BCR 2.6:1, payback 2.8 years
Implementation: PRV installed month 3, pressure monitoring validates 28% night reduction achieved (close to 30% prediction), measured zone MNF decreased 20% (from 2,800 to 2,240 m³/day), confirming substantial leakage reduction, customer satisfaction maintained (zero low-pressure complaints), validating EPANET-guided design approach
Implementation Insight: EPANET's greatest value in pressure management lies not in performing calculations too complex for manual methods but in enabling rapid iteration through dozens of alternative scenarios identifying optimal solutions humans cannot intuitively predict given network complexity, non-linear pressure-leakage relationships, and multiple interacting constraints. Indonesian utilities should exploit this scenario analysis capability systematically exploring design space rather than implementing first plausible idea investment of 2-5 additional days modeling effort often identifies solutions 20-40% more effective than initial concepts, returning massive value through permanently improved infrastructure performance.
Integration with Leak Detection Programs: EPANET Supporting Systematic Survey Planning and Validation
EPANET modeling and leak detection field programs form complementary partnership where modeling guides survey priorities identifying high-probability leakage zones requiring intensive investigation, while detection results validate and refine model assumptions improving predictive accuracy for future analyses. The integration operates bidirectionally: model-to-field direction uses EPANET simulations predicting where leakage most likely concentrates based on pressure distributions, pipe age/condition overlays, and historical failure patterns, focusing limited survey resources on highest-return areas rather than unfocused network-wide coverage often missing critical leaks while wasting effort on low-loss zones. Field-to-model direction feeds leak detection findings back into EPANET updating leakage allocations based on discovered leak densities, validating pressure predictions against logger data collected during surveys, and identifying discrepancies between modeled and actual system behavior revealing either modeling errors requiring correction or operational anomalies (unmapped infrastructure, unauthorized connections, valve position errors) warranting investigation beyond model improvement alone.
For Indonesian utilities implementing integrated NRW programs, this EPANET-detection synergy delivers multiple practical benefits: survey cost optimization directing expensive acoustic equipment and skilled crews toward zones where modeling indicates highest leakage probability maximizing leak finds per survey kilometer; intervention prioritization where detected leaks ranked by modeled pressure at leak location (high-pressure leaks generate more flow loss, repair yields greater savings) rather than arbitrary first-found first-repaired approach potentially addressing low-impact leaks while missing high-flow losses; performance validation quantifying actual NRW reduction from detection programs by comparing pre-survey and post-survey zone flows against EPANET predictions of expected improvement validating program effectiveness and justifying continued investment; and continuous improvement cycle where each detection campaign generates data improving model accuracy enabling better targeting in subsequent surveys, progressively enhancing program efficiency over multi-year implementation achieving compounding returns from integrated approach versus isolated modeling or detection efforts yielding suboptimal results independently.
Table 3: EPANET Applications Supporting Leak Detection and Survey Programs
| EPANET Application | Methodology and Analysis Approach | Practical Benefits for Detection Programs | Indonesian Implementation Example |
|---|---|---|---|
| Leakage Hot Spot Identification | Overlay pressure distribution (from EPANET) with pipe age/material data, compute "leakage susceptibility index" combining high pressure + old pipes + historical breaks, rank network segments by predicted leak density | Focuses survey effort on 20-30% of network predicted to contain 50-70% of total leakage, achieving 2-3× higher leak detection rates (leaks per km surveyed) versus random coverage, maximizes return on limited detection budget | PDAM Bandung Zone identified top 15 km (8% of zone length) for priority survey using pressure-age overlay, survey found 47 leaks (3.1 leaks/km) versus 0.8 leaks/km in control areas, validating targeting approach |
| Night Flow Analysis and Leakage Quantification | Model minimum night flow period (02:00-04:00 AM) with realistic night demand pattern, compare predicted MNF (legitimate use + modeled leakage) against measured DMA flows, difference indicates unmodeled leakage requiring investigation | Quantifies leakage magnitude at zone level establishing baseline for detection programs, tracks reduction as leaks repaired (decreasing MNF), identifies zones with excessive MNF requiring intensive survey versus zones meeting targets allowing lower priority | Surabaya DMA model predicted MNF 3,200 m³/day (15% legitimate night use + 10% modeled leakage), measured flow 4,100 m³/day, 900 m³/day discrepancy (28% above prediction) triggered comprehensive survey finding 127 unreported service connection leaks explaining gap |
| Leak Impact Assessment and Repair Prioritization | For each detected leak, query EPANET model for pressure at leak location, estimate leak flow using orifice equation Q = C × A × √(2gH), rank detected leaks by flow rate (high-flow leaks prioritized for immediate repair) | Optimizes repair sequencing addressing highest-impact leaks first when resource constraints prevent simultaneous repair of all findings, ensures water savings maximized even with delayed repair of lower-priority leaks, justifies emergency repairs for extreme flows | Jakarta detection survey found 89 leaks, model analysis revealed 12 leaks at high-pressure locations (65-75 m head) estimated at 120-180 m³/day total flow versus 77 low-pressure leaks (25-35 m head) at 45-65 m³/day total, prioritizing high-pressure repairs yielded 65% of potential savings from 14% of leak count |
| Survey Efficiency Optimization | Model network identifying optimal survey routes minimizing travel time between listening points (junctions, valves, hydrants), group adjacent high-priority pipes into survey zones achieving 8-12 km per shift (versus 4-6 km with poor routing) | Increases surveyor productivity 30-50% through efficient routing, reduces per-kilometer survey cost, enables more frequent survey cycles or greater network coverage within fixed budget improving overall program effectiveness | Medan survey team using GIS-EPANET routing achieved 9.2 km average per night shift versus historical 5.8 km, 59% productivity increase enabled annual survey coverage expanding from 180 km to 285 km without additional crew hiring |
| Correlation Point Selection | For leak noise correlation, EPANET identifies optimal sensor placement points (valves, hydrants) flanking suspect pipe sections at 100-300m spacing, ensures adequate coverage while minimizing setup count, verifies no interfering branches affecting correlation accuracy | Improves correlation success rate through optimal sensor placement, reduces false positives from poor point selection, enables pre-planning correlation campaigns (identify all setups before field deployment improving efficiency) | Semarang correlation program used EPANET to pre-plan 45 correlation setups across priority zone, field team executed plan achieving 78% positive correlation rate (leak confirmed within ±3m of calculated position) versus 55% historical rate with ad-hoc point selection |
| Post-Repair Validation and Model Updating | After leak repairs, measure zone flow reduction, compare against EPANET prediction of expected savings based on repaired leak pressures and estimated orifice sizes, update model leakage allocation removing repaired leaks improving future predictions | Validates leak detection program effectiveness (if measured savings match predictions, program working; if savings less than expected, investigation required for unreported remaining leaks or model errors), builds organizational confidence in integrated approach, enables performance-based contracting | Yogyakarta DMA repair program predicted 850 m³/day savings from 34 leak repairs (based on EPANET pressure analysis), measured reduction 780 m³/day (92% of prediction), validating both model accuracy and repair effectiveness, residual 70 m³/day gap triggered follow-up survey finding 3 additional unreported leaks |
| Pressure Logger Deployment Planning | Use EPANET to identify strategic logger locations capturing representative pressure variations, high/low pressure extremes, critical customer areas, and validation points for model calibration, optimize logger count balancing coverage versus available equipment | Maximizes value from limited logger inventory (typical PDAM has 10-30 loggers for networks requiring 50-100+ points for complete coverage), ensures critical areas monitored, provides model validation dataset improving confidence for survey targeting and prioritization decisions | Malang deployment plan using EPANET identified 18 optimal logger locations (from 47 candidate points) capturing 85% of network pressure variability, 2-week campaign generated calibration dataset achieving ±8% model accuracy enabling confident survey targeting and PRV design for subsequent NRW program phases |
Integration effectiveness depends critically on data feedback loops where field observations systematically inform model updates rather than one-way model-to-field information flow. Indonesian utilities should establish protocols requiring detection teams to report: leak locations (GPS coordinates), estimated leak sizes/flows (visual assessment or flow meter if available), and pressure at leak location (portable gauge measurement), feeding data into GIS-EPANET database enabling continuous model refinement and improving targeting accuracy for future survey cycles creating virtuous cycle of progressive improvement versus static models becoming increasingly outdated and unreliable over time.
Workflow Diagram: Integrated EPANET-Leak Detection Program Cycle
Continous Improvement Cycle
Model → Detect → Repair → Validate → Update Model → Repeat
| PHASE 1 Baseline Modeling |
→ |
EPANET Model Development and Calibration
|
| PHASE 2 Survey Planning |
→ |
Model-Guided Survey Zone Prioritization
|
| PHASE 3 Field Detection |
→ |
Acoustic Survey Execution and Leak Location
|
| PHASE 4 Impact Analysis |
→ |
EPANET-Based Leak Flow Estimation and Prioritization
|
| PHASE 5 Repair & Monitor |
→ |
Leak Repair and Flow Reduction Measurement
|
| PHASE 6 Validation & Update |
→ |
Model Validation and Knowledge Base Update
|
Cycle Performance Metrics and Continuous Improvement Indicators
- Survey effectiveness: Leaks found per km surveyed (target: >0.5 leaks/km in priority zones vs <0.2 in low-priority zones, validating targeting)
- Prediction accuracy: Actual water savings / EPANET predicted savings (target: 0.8-1.2 ratio indicating reliable modeling supporting confident future decisions)
- Economic efficiency: Cost per m³ water saved = (Survey cost + Repair cost) / Annual water savings (target:
- Progressive improvement: Track leak find rate and prediction accuracy across multiple cycles, should improve 10-20% per cycle as targeting refines and model accuracy increases
- Knowledge accumulation: Build leak pattern database (leak types by pipe material, age, pressure) informing infrastructure investment strategy beyond immediate detection benefits
Infrastructure Rehabilitation Analysis: EPANET Supporting Investment Prioritization and Alternative Evaluation
Infrastructure rehabilitation represents long-term strategic solution addressing root causes of persistent leakage through systematic pipe replacement, renovation, or upgrade, contrasting with operational interventions (leak detection, pressure management) that manage symptoms of deteriorating assets rather than eliminating underlying problems. EPANET plays critical role in rehabilitation planning by enabling comparative analysis of alternative investment scenarios quantifying expected NRW reduction, service quality improvements, and hydraulic capacity gains from different pipe replacement programs, supporting data-driven capital budget allocation decisions determining which rehabilitation projects deliver maximum value for limited financial resources. Indonesian utilities typically face rehabilitation backlogs where 30-60% of network exceeds design life requiring eventual replacement, with annual rehabilitation budgets (typically 5-15% of capital budgets or IDR 5-100 billion depending on utility size) insufficient for addressing entire backlog simultaneously necessitating multi-decade programs requiring rigorous prioritization ensuring most critical infrastructure receives attention first while minimizing service disruptions and customer impacts during implementation.
Furthermore, EPANET enables sophisticated analysis beyond simple age-based replacement by incorporating hydraulic performance considerations where rehabilitation decisions account for not only condition deterioration but also capacity adequacy, pressure optimization opportunities, and operational improvement potential. For instance, modeling might reveal that replacing 2 km of aged 150mm main with 200mm pipe provides both leakage reduction (eliminating deteriorated pipe prone to failures) and capacity upgrade (reducing head loss, improving downstream pressures) delivering dual benefits from single investment, achieving better value than replacing equal length of 200mm main in good condition experiencing minimal leakage but consuming equivalent budget. Similarly, rehabilitation planning can integrate with pressure management strategies where pipe replacement in high-pressure zones receives lower priority (leakage controlled via PRVs deferring replacement) while low-pressure zones experiencing capacity constraints receive priority attention (rehabilitation necessary for service quality regardless of leakage considerations), optimizing overall infrastructure program balancing NRW reduction against service delivery imperatives comprehensively rather than single-objective optimization potentially creating unintended consequences.
Table 4: EPANET-Based Rehabilitation Scenario Analysis Framework
| Analysis Type | EPANET Modeling Approach | Decision Support Outputs | Practical Application Example |
|---|---|---|---|
| Alternative Comparison (Which pipes to replace?) | Develop multiple scenarios: Scenario A (replace highest break rate pipes), Scenario B (replace oldest pipes), Scenario C (replace high-pressure zone pipes), Scenario D (combined approach). Model each scenario comparing hydraulic performance. | • Pressure improvement maps for each scenario • Expected leakage reduction (pressure decrease + deteriorated pipe removal) • Cost per unit benefit (IDR per m³ water saved, IDR per meter pressure improvement) • Ranking matrix identifying optimal scenario |
PDAM analyzed 4 scenarios for IDR 50 billion budget: Scenario C (high-pressure zone replacement) delivered 18% NRW reduction vs 12% for Scenario A, despite A having higher break rates, pressure effect dominated making C optimal choice |
| Pipe Sizing Optimization (What size to install?) | When replacing pipes, test alternative diameters: like-for-like (150mm replacing 150mm) vs upsizing (200mm replacing 150mm). Model head loss, velocities, pressures under current and future demand projections (10-20 year horizon). | • Hydraulic capacity analysis (adequate for peak demands?) • Pressure improvement from upsizing (reduced head loss) • Incremental cost vs benefit (larger pipe costs more but delivers capacity buffer) • Future-proofing assessment (avoids premature replacement) |
Jakarta main replacement study showed upsizing 3.2 km from 200mm to 250mm added IDR 8 billion cost but eliminated capacity constraint serving 8,000 planned new connections, deferring IDR 25 billion separate capacity expansion project, strongly positive NPV justifying upsizing |
| Phased Implementation Sequencing | For multi-year programs exceeding single-year budget, model various implementation sequences (Year 1: Zone A, Year 2: Zone B vs reverse sequence). Analyze cumulative benefits, service impacts, and coordination opportunities (e.g., road reconstruction timing). | • Optimized implementation schedule maximizing early benefits • Identification of critical infrastructure requiring priority attention • Coordination with external factors (road programs, development projects) • Annual budget allocation plan (IDR requirements by year) |
Surabaya 5-year program modeled 12 possible sequences for 18 km replacement, optimal sequence delivered 24% cumulative NRW reduction (sum across all years) vs 18% for worst sequence, prioritizing zones feeding hospitals and commercial centers providing both water savings and service quality benefits |
| Rehabilitation vs Pressure Management Trade-offs | Compare rehabilitation investment (pipe replacement reducing leakage by eliminating deteriorated assets) vs pressure management (PRV installation reducing leakage by lowering pressure on existing assets). Model both approaches for same budget. | • Leakage reduction comparison (which approach more effective?) • Permanence assessment (rehabilitation permanent, pressure management requires ongoing maintenance) • Service quality impacts (rehabilitation improves capacity, pressure management may constrain) • Economic analysis (capital cost, O&M cost, lifecycle cost) |
Bandung study for Zone with IDR 40 billion budget: Option 1 (replace 8 km worst pipes) = 14% NRW reduction; Option 2 (install 6 PRVs + replace 2 km critical pipes) = 19% reduction at lower cost IDR 32 billion, Option 2 selected delivering superior short-term results, pipe replacement deferred 5-8 years under reduced pressure extending asset life |
| Network Reconfiguration Analysis | Test major topology changes: rerouting mains, creating separate pressure zones from single source, adding new interconnections for redundancy. Model current vs proposed configurations comparing performance metrics. | • Hydraulic performance comparison (pressure, capacity, reliability) • Capital cost estimate (new pipes, valves, pumps for reconfiguration) • Operational benefits (simplified operations, better pressure control) • Risk assessment (redundancy, emergency supply paths) |
Medan analyzed creating two pressure zones (high/low elevation) from single pumped system, required IDR 120 billion (new tank, pumps, mains separation), modeling predicted 28% energy savings (no overpressure at low elevation) + 22% leakage reduction, payback 6.8 years justified by substantial operational savings |
| Climate Change and Demand Growth Adaptation | Model future scenarios with increased demands (population/economic growth), changing patterns (climate adaptation, water conservation), and supply constraints (source depletion, quality degradation). Assess whether rehabilitation programs adequate for future needs. | • Future hydraulic adequacy assessment (capacity sufficient for 2030/2040 demands?) • Climate resilience evaluation (system vulnerable to drought, flooding impacts?) • Adaptive strategies (flexible pipe sizing, modular expansion capability) • Long-term investment roadmap (beyond current 5-year plan) |
Semarang coastal zone modeled sea level rise impacts (saltwater intrusion reducing available sources), 2040 scenario showed existing rehabilitation plan inadequate (capacity deficit 15,000 m³/day), triggering augmented program including source diversification and larger-diameter distribution mains securing long-term sustainability |
Rehabilitation analysis benefits tremendously from EPANET's scenario comparison capability enabling rapid evaluation of dozens of alternatives identifying non-obvious optimal solutions. Indonesian utilities should exploit this by systematically exploring design space rather than implementing first feasible option Investing 1-2 weeks additional modeling effort (marginal cost IDR 10-20 million for consultant support if internal capacity limited) often identifies solutions 20-50% more cost-effective than initial concepts, returning enormous value through permanently improved infrastructure decisions affecting system performance for 30-50 year asset lifecycles.
Rehabilitation Prioritization Matrix: EPANET-Supported Multi-Criteria Decision Framework
Comprehensive Scoring System Integrating EPANET Outputs with Asset Management Data:
| Criterion | Data Source | Scoring Method (0-10 scale) | Weight | EPANET Role |
|---|---|---|---|---|
| Pipe Age & Condition | Asset database, installation records | 10: >50 years or severe corrosion 7: 30-50 years moderate condition 4: 20-30 years fair condition 1: <20 years good condition |
25% | Indirect: older pipes assigned higher roughness in calibration, validating condition assessment |
| Failure History | Maintenance records, GIS break database | 10: >1.0 breaks/km/year 7: 0.5-1.0 breaks/km/year 4: 0.2-0.5 breaks/km/year 1: <0.1 breaks/km/year |
20% | Indirect: high break areas used for leakage allocation, model helps explain break patterns via pressure analysis |
| Leakage Impact (EPANET-derived) | EPANET model pressure analysis | 10: High pressure (>60m) + high leak density = estimated >500 m³/day/km 5: Moderate pressure/leakage = 200-500 m³/day/km 1: Low pressure or new pipe = <200 m³/day/km |
30% | DIRECT: Model provides pressure at each pipe, combined with age/condition estimates leak flow, core NRW criterion |
| Hydraulic Capacity Constraint | EPANET peak hour simulation | 10: Severe capacity deficit (velocities >3.5 m/s, downstream pressure <15m) 5: Marginal adequacy (velocities 2.5-3.5 m/s) 1: Excess capacity (velocities <1.5 m/s) |
15% | DIRECT: Model calculates flows, velocities, pressures identifying undersized pipes requiring upsizing during replacement |
| Criticality / Consequence | Customer database, facility inventory | 10: Serves critical facility (hospital) or >10,000 customers with no redundancy 5: Serves 2,000-10,000 customers or has backup 1: Serves <500 customers with alternative supply |
10% | Moderate: Model identifies redundancy (can flow be rerouted if pipe fails?) informing criticality assessment |
Composite Score Calculation and Project Selection Process
- Individual pipe segment scoring: For each pipe in network, calculate weighted score = Σ(Criterion Score × Weight Factor), range 0-10 with higher scores indicating higher rehabilitation priority
- Network-wide ranking: Sort all pipes by composite score descending, creating prioritized list from highest to lowest priority
- Cost-benefit overlay: Estimate rehabilitation cost for each pipe (length × unit cost by diameter), calculate benefit (annual water savings from leakage reduction + capacity value if applicable), compute BCR = Benefits / Cost
- Budget allocation: Starting from top-ranked pipes, sequentially select projects until annual budget consumed (e.g., IDR 50 billion), subject to BCR >1.5 threshold (exclude negative-return projects even if high condition priority)
- Practical constraints: Adjust selection for implementation feasibility (group adjacent pipes into coherent projects, coordinate with road programs, balance geographic distribution preventing excessive concentration, respect operational capacity limits on annual program size)
Example Application: 500km Distribution Network, IDR 60 Billion Annual Budget
Analysis Results: Prioritization scoring identified top 85 km of pipe segments (17% of network) with composite scores >7.0, representing worst condition combined with high NRW impact and capacity constraints.
Budget-Constrained Selection: IDR 60 billion budget enables replacement of 12 km per year (at average IDR 5 million/meter including mobilization, traffic management, restoration). Over 5-year program, 60 km of highest-priority pipes replaced.
Expected Outcomes: EPANET modeling of replacement program predicts: 16% system-wide NRW reduction (from 38% to 22%), elimination of 320 breaks/year (reducing emergency repairs), pressure improvement 8-12 m in affected zones (enabling service expansion), total NPV IDR 185 billion over 15-year horizon (BCR 2.1:1 validating investment)
Continuous Refinement: After Year 1 implementation (12 km replaced), update prioritization with new condition data, remaining budget allocated to next-highest priorities in Year 2, iterative process ensuring most critical infrastructure continuously addressed as network evolves
Concluding Insights: EPANET as Strategic Asset for Indonesian Water Sector Development
EPANET hydraulic modeling software represents transformative tool for Indonesian water utilities seeking to systematically address non-revenue water challenges, optimize infrastructure investments, and enhance operational efficiency through evidence-based analytical approaches replacing historically dominant reactive management and intuition-driven decision-making with rigorous predictive modeling supporting confident, optimized interventions. The software's open-source availability, extensive global user community, comprehensive documentation, and proven track record across thousands of applications worldwide including growing number of successful Indonesian implementations demonstrate both technical maturity and practical applicability for local conditions, budget constraints, and institutional capabilities characteristic of Indonesian water sector overcoming historical barriers limiting advanced analytical tool adoption to largest, best-resourced utilities.
Furthermore, EPANET adoption aligns strategically with Indonesian national water sector development priorities including universal access targets requiring efficient resource utilization and loss minimization, sustainability commitments demanding reduced environmental impacts through water conservation and energy optimization, commercial viability imperatives requiring improved operational efficiency and reduced non-revenue water supporting financial sustainability without excessive tariff increases, and institutional modernization recognizing that technical capacity development and analytical capability building essential for sector professionalization and performance improvement beyond physical infrastructure investment alone. Utilities investing systematically in EPANET capability development, through staff training, data infrastructure improvement, pilot project implementation, and institutional integration, position themselves strategically for sustained performance improvement capturing ongoing value from enhanced decision-making across all infrastructure and operational programs affecting hundreds of millions to billions of rupiah in optimized investments and operational savings annually.
Looking forward, Indonesian water sector should prioritize EPANET capacity development as core element of utility modernization programs recognizing exceptional return on investment from relatively modest capability-building expenditure (typically IDR 150-300 million comprehensive implementation program) delivering permanent analytical infrastructure supporting decades of improved decision-making. Government support programs, donor assistance, and sector associations like PERPAMSI can accelerate adoption through regional training centers, knowledge sharing platforms, and peer learning networks enabling smaller utilities to access expertise and best practices overcoming capacity constraints limiting independent implementation. Ultimately, widespread EPANET adoption throughout Indonesian water sector will contribute substantially to achieving universal water access goals, improving sector financial sustainability, enhancing service quality and reliability, and positioning Indonesian utilities among regional leaders in analytical capability and evidence-based infrastructure management advancing from reactive, crisis-driven operations toward proactive, optimized systems delivering high-quality, sustainable water services for growing urban populations at affordable costs supporting economic development and quality of life improvements nationwide.

Professional EPANET Modeling and NRW Reduction Services
SUPRA International provides comprehensive hydraulic modeling and non-revenue water reduction services for Indonesian water utilities, municipalities, and property developers including EPANET model development and calibration from infrastructure data compilation through validated predictive models, pressure management system design with PRV specification and DMA boundary optimization, rehabilitation planning and investment prioritization using multi-criteria analysis frameworks, operational optimization for energy reduction and leakage control, capacity building programs training utility staff in EPANET application and NRW management methodologies, and ongoing technical support ensuring sustained modeling capability beyond initial project implementation. Our engineering team combines international best practice expertise with deep understanding of Indonesian utility operational realities, regulatory frameworks, and infrastructure constraints delivering practical, implementable solutions achieving measurable results.
Planning NRW reduction program requiring hydraulic modeling support?
Contact our water infrastructure specialists to discuss EPANET model development, pressure management design, or comprehensive leakage reduction strategies tailored to your system's specific challenges and opportunities
Share:
If you face challenges in water, waste, or energy, whether it is system reliability, regulatory compliance, efficiency, or cost control, SUPRA is here to support you. When you connect with us, our experts will have a detailed discussion to understand your specific needs and determine which phase of the full-lifecycle delivery model fits your project best.