Technical Framework for Groundwater Quality Monitoring Using Monitoring Wells: International Guidelines, Design Standards, Sampling Protocols, and Quality Assurance Procedures
Technical Framework for Groundwater Quality Monitoring Using Monitoring Wells: International Guidelines, Design Standards, Sampling Protocols, and Quality Assurance Procedures
Reading Time: 70 minutes
Key Highlights
• Comprehensive Monitoring Framework: Groundwater quality monitoring requires integrated approach combining monitoring well network design, representative sampling protocols, comprehensive analytical testing, quality assurance procedures, data validation and interpretation, trend analysis, and regulatory reporting following international standards from USGS, EU Water Framework Directive, UN-IGRAC, and WHO guidelines ensuring scientifically defensible results
• Monitoring Well Design Standards: Proper well construction follows specifications including appropriate screen placement in target aquifer zones, filter pack gradation preventing sediment entry while maximizing hydraulic communication, bentonite seals isolating screen intervals from surface infiltration, surface completion protecting well integrity, and development procedures removing drilling impacts enabling representative groundwater sampling over decades-long monitoring programs
• Sampling Protocol Requirements: Low-flow purging and sampling methods minimize sample disturbance and provide representative groundwater chemistry with field parameter stabilization (pH, temperature, conductivity, dissolved oxygen, turbidity) indicating formation water recovery, proper sample preservation preventing degradation, chain-of-custody documentation ensuring sample integrity, and quality control samples (duplicates, blanks, spikes) verifying data reliability
• Data Quality Management: Quality assurance programs encompass detailed sampling and analysis plans defining data quality objectives, standard operating procedures ensuring consistency, field and laboratory QC samples detecting problems, data validation procedures evaluating result acceptability, statistical analysis identifying trends and spatial patterns, and reporting frameworks communicating findings to stakeholders supporting groundwater resource management and protection decisions
Executive Summary
Groundwater quality monitoring constitutes essential component of water resource management, environmental protection, contamination assessment, and regulatory compliance programs requiring systematic collection and analysis of groundwater samples from monitoring wells installed specifically for long-term surveillance purposes. Unlike water supply wells designed for maximum production, monitoring wells prioritize sample representativeness through controlled construction specifications, minimal disturbance sampling techniques, and quality assurance protocols ensuring data reliability for characterizing baseline conditions, detecting contamination, tracking temporal trends, evaluating remediation effectiveness, and assessing compliance with drinking water standards or environmental quality criteria. International organizations including United Nations International Groundwater Resources Assessment Centre (UN-IGRAC), United States Geological Survey (USGS), European Union Water Framework Directive programs, World Health Organization (WHO), and professional associations developed comprehensive guidelines establishing best practices for monitoring network design, well construction, sampling procedures, analytical methods, quality control, and data interpretation applicable across diverse hydrogeological settings and monitoring objectives.
Monitoring well networks require strategic design balancing spatial coverage, hydrogeological understanding, temporal sampling frequency, analytical parameters, budget constraints, and programmatic objectives whether focused on regional aquifer status assessment, contamination plume delineation, industrial facility compliance monitoring, or remediation performance verification. Network design considerations include conceptual hydrogeological model development identifying aquifer characteristics and groundwater flow patterns, monitoring objective definition establishing data quality requirements, well location selection providing representative coverage of aquifer zones or contamination areas, screen interval placement targeting specific water-bearing zones, sampling frequency determination capturing temporal variability, and parameter selection addressing relevant water quality concerns from natural geochemistry or anthropogenic contamination sources. International guidelines emphasize scientifically defensible approaches integrating hydrogeological understanding with statistical design principles ensuring monitoring programs generate reliable data supporting informed management decisions while optimizing resource allocation avoiding unnecessary sampling or analysis costs.
Monitoring well construction follows rigorous specifications ensuring long-term functionality and sample representativeness including borehole advancement using methods minimizing formation disturbance, casing and screen materials resistant to corrosion and chemical interaction with groundwater, filter pack placement facilitating groundwater flow while preventing sediment entry, annular seals preventing surface water infiltration or cross-contamination between aquifer zones, surface completion protecting well integrity from damage and unauthorized access, and development procedures removing drilling fluids and sediment mobilizing formation fines enabling native groundwater flow. Construction quality directly affects data quality with poorly constructed wells potentially providing biased samples from surface infiltration, cross-connected aquifers, or inadequate development causing persistent turbidity and unrepresentative chemistry. International standards including ASTM, ISO, and national guidelines (USGS, British Standards, Australian standards) provide detailed specifications addressing materials selection, installation procedures, development protocols, and documentation requirements ensuring monitoring wells perform intended functions throughout programmatic lifespans potentially extending decades.
Sampling procedures evolved from traditional high-volume purging methods removing multiple well volumes before sample collection to low-flow techniques minimizing disturbance while achieving representative samples through field parameter stabilization indicating formation water recovery. Low-flow purging utilizing pumps at rates typically 0.1-0.5 liters per minute maintains minimal drawdown in well preserving natural flow conditions and reducing sediment mobilization, with continuous field parameter monitoring (pH, temperature, specific conductance, dissolved oxygen, oxidation-reduction potential, turbidity) identifying stabilization indicating representative formation water rather than stagnant well bore water. Sample collection, preservation, handling, and transport follow strict protocols preventing contamination or degradation affecting analytical results, with method-specific requirements for container types, preservatives, temperature control, holding times, and chain-of-custody documentation providing sample integrity verification. Quality control samples including field duplicates assessing precision, equipment blanks detecting contamination from sampling equipment, trip blanks monitoring transport impacts, and field blanks evaluating ambient contamination provide data quality verification enabling confident interpretation of analytical results.
Analytical methods selection depends on monitoring objectives, regulatory requirements, detection limit needs, and budget constraints, with comprehensive monitoring programs potentially analyzing dozens of parameters spanning general chemistry (pH, conductivity, major ions), nutrients (nitrate, ammonia, phosphate), metals (heavy metals, trace elements), organic contaminants (volatile organics, petroleum hydrocarbons, pesticides, industrial chemicals), and microbiological indicators (total coliform, E. coli, heterotrophic plate count). Laboratory selection requires verification of accreditation status (ISO 17025 or equivalent), method validation for required parameters, appropriate detection limits enabling regulatory comparison, quality control procedures, and reporting formats meeting program needs. Analytical costs constitute significant monitoring program expenses requiring strategic parameter selection balancing comprehensive characterization needs against budget constraints, with tiered approaches potentially employing indicator parameters for routine monitoring supplemented by periodic comprehensive analysis or triggered investigation when indicators suggest emerging problems.
Data management, interpretation, and reporting transform analytical results into actionable information supporting decision-making through quality assurance evaluation, statistical analysis, spatial and temporal trend assessment, comparison to standards or background conditions, conceptual model refinement, and stakeholder communication. Data validation procedures verify analytical quality control acceptability, identify outliers or questionable results requiring confirmation, and assign data qualifiers communicating limitations affecting interpretation. Statistical methods including summary statistics, graphical presentation, trend analysis, spatial interpolation, and hypothesis testing characterize groundwater quality conditions, detect changes over time or space, and evaluate significance of observed differences. Reporting formats vary from routine data tables for regulatory compliance to comprehensive interpretive reports synthesizing multiple years of data identifying patterns, emerging concerns, and management recommendations. International frameworks emphasize transparency in data quality documentation, conservative interpretation acknowledging uncertainties, and clear communication of findings to diverse audiences including technical specialists, regulators, policymakers, and affected communities requiring accessible presentation of technical information.
This comprehensive technical framework integrates international best practices from UN-IGRAC global assessment guidelines, USGS monitoring program design principles, EU Water Framework Directive implementation guidance, WHO drinking water quality surveillance methods, and professional society standards providing detailed protocols for monitoring network design, well construction specifications, sampling procedures, analytical methods, quality assurance practices, data interpretation approaches, and reporting frameworks. Framework serves environmental professionals designing monitoring programs, regulators developing oversight requirements, facility operators implementing compliance monitoring, consultants conducting groundwater investigations, and researchers advancing monitoring methodologies. Application of systematic, quality-assured approaches ensures groundwater monitoring generates reliable data supporting sustainable resource management, contamination prevention and remediation, public health protection, and environmental stewardship across diverse settings from pristine aquifers requiring protection to contaminated sites undergoing cleanup, from localized facility monitoring to regional aquifer assessment programs serving millions of people depending on groundwater for drinking water supply and economic development.
Essential International Guidelines - Download Center
Access comprehensive technical guidance documents from leading international organizations establishing groundwater quality monitoring standards and best practices worldwide:
UN-IGRAC Guidelines for Groundwater Quality Assessment (2024)
Structured methodology for global-scale groundwater quality evaluation including monitoring network design, data collection protocols, parameter selection, Groundwater Quality Index (GQI) calculation aligned with SDG 6.3.2 indicators, and trend analysis procedures for national and transboundary aquifer assessment programs.
WWQA Guidelines for Groundwater Quality Assessment
Proposes global standards for regional groundwater quality assessments including monitoring network implementation strategies, quality indices development, parameter selection rationale, and assessment frameworks harmonizing international approaches to groundwater quality characterization and reporting.
EU Groundwater Monitoring Guidance (Water Framework Directive)
Details quantitative and chemical status monitoring programs for groundwater bodies including surveillance network design, operational monitoring protocols, investigative monitoring procedures, trend assessment methodologies, and status classification frameworks ensuring WFD compliance across European Union member states.
USGS Framework for Ground-Water Quality Monitoring (California)
Comprehensive framework outlining monitoring program design principles for groundwater quality assessment including network conceptualization, well placement strategies, sampling frequency determination, analytical parameter selection, quality assurance protocols, and data interpretation methodologies applicable to diverse hydrogeological settings.
World Bank Practical Manual on Groundwater Quality Monitoring
Resource for policymakers and practitioners providing historical perspectives on groundwater quality evolution, monitoring practice development, institutional frameworks, capacity building approaches, and practical implementation guidance for developing countries establishing groundwater quality surveillance programs.
GSEU Methodology for Assessing Groundwater Quality
Transnational protocol developed by Geological Service of Europe for standardized groundwater quality assessment across borders including harmonized sampling procedures, analytical methods, quality control requirements, data exchange formats, and joint reporting frameworks supporting integrated transboundary aquifer management.
Monitoring Well Network Design and Conceptualization
Monitoring well network design begins with clear programmatic objectives defining what information monitoring aims to provide, whether characterizing regional aquifer quality status, detecting contamination from potential sources, delineating contamination plume extent, tracking temporal trends in water quality, evaluating remediation system performance, demonstrating regulatory compliance, or supporting groundwater resource management decisions. Objectives directly influence network configuration, well density, screen placement depth, sampling frequency, analytical parameters, and data quality requirements with different monitoring goals requiring distinct approaches. Regional aquifer assessment typically employs widely spaced wells (kilometers apart) sampling major aquifer units on multi-year intervals, whereas contamination plume monitoring requires dense well spacing (tens to hundreds of meters) with quarterly to annual sampling targeting specific contaminants at detection limits enabling early warning. Clear objective articulation prevents inefficient monitoring generating data that fails to address actual information needs while consuming resources better allocated to targeted assessment.
Conceptual hydrogeological model development synthesizes available information about aquifer geometry, hydraulic properties, groundwater flow patterns, recharge and discharge areas, interactions with surface water, and water quality patterns forming foundation for rational well placement decisions. Model components include stratigraphic framework identifying water-bearing units and confining layers, potentiometric surface maps showing groundwater flow directions and gradients, aquifer property distributions indicating transmissivity and storage variations, recharge source characterization including precipitation infiltration and surface water losses, and discharge mechanisms through pumping wells, springs, streams, or evapotranspiration. Three-dimensional visualization of hydrogeological system enables identification of strategic well locations capturing representative aquifer conditions, areas of particular interest or concern, and spatial coverage adequate for characterizing system-wide quality patterns. Model development utilizes existing data from geological maps, borehole logs, aquifer tests, water level measurements, and previous investigations, supplemented by reconnaissance investigations filling critical data gaps affecting network design decisions.
Monitoring Network Design Considerations:
Spatial Coverage and Well Density:
• Regional aquifer monitoring: Well spacing 5-50 km targeting major aquifer units across study area
• Contamination source monitoring: Upgradient background wells, source area wells, downgradient sentinel wells
• Plume delineation: Well transects perpendicular to flow with spacing 50-200 m defining lateral extent
• Vertical profiling: Multi-level wells or well clusters sampling different depth intervals in thick aquifers
• Statistical design: Geostatistical methods determining well density for desired interpolation accuracy
• Representative coverage: Wells distributed across hydrogeologic units, land uses, potential impact areas
• Access considerations: Practical constraints from land ownership, site access, surface development
Screen Interval Placement:
• Target aquifer identification: Screen placement in producing aquifer zones representative of water supply use
• Depth considerations: Deep wells sampling lower aquifer, shallow wells detecting early contamination arrival
• Screen length: Short screens (1-3 m) for discrete interval sampling, longer screens (3-10 m) for integrated samples
• Multiple screened intervals: Nested wells or multi-level samplers characterizing vertical quality variations
• Water table wells: Screen spanning seasonal water table fluctuations in unconfined aquifers
• Confined aquifer wells: Screen centered in productive zones away from confining layers
• Contamination monitoring: Screen placement targeting expected contamination depth based on contaminant density
Temporal Sampling Design:
• Baseline characterization: Intensive initial sampling (quarterly first year) establishing baseline variability
• Long-term monitoring: Annual or biennial sampling for stable systems tracking slow trends
• Seasonal variability: Wet and dry season sampling capturing seasonal quality variations
• Contamination detection: Quarterly to semi-annual sampling enabling timely problem identification
• Remediation monitoring: Monthly to quarterly sampling during active treatment assessing performance
• Compliance monitoring: Sampling frequency specified by permits or regulations (often quarterly/annual)
• Event-based sampling: Triggered sampling following spills, heavy precipitation, or operational changes
Parameter Selection Strategy:
• Regulatory requirements: Parameters specified in permits, drinking water standards, or environmental regulations
• Site-specific concerns: Contaminants based on industrial activities, waste disposal, agricultural practices
• Indicator parameters: General chemistry (pH, conductivity, major ions) characterizing overall water type
• Contaminant screening: Comprehensive initial analysis followed by targeted routine monitoring
• Natural water quality: Background parameters (hardness, alkalinity, iron, manganese) affecting usability
• Nutrients: Nitrate, ammonia, phosphate particularly in agricultural or urban influenced areas
• Redox indicators: Dissolved oxygen, ORP, nitrate, iron, sulfate indicating geochemical conditions
• Cost optimization: Tiered approach with routine indicator parameters, periodic comprehensive analysis
Well location selection balances hydrogeological objectives with practical constraints including land access, surface development limiting drilling locations, utility conflicts requiring clearance, budget limitations constraining well numbers, and logistical considerations affecting installation and sampling efficiency. Strategic well placement prioritizes locations providing maximum information value including aquifer boundaries where quality changes expected, flow path transects intercepting upgradient and downgradient conditions, known or potential contamination source areas requiring surveillance, water supply well fields where quality directly affects usage, and areas of particular sensitivity from proximity to surface water, ecological receptors, or concentrated water users. Permitting requirements potentially affecting well installation timing and costs include land owner permission, local government drilling permits, environmental review for protected areas, and coordination with water resource agencies regulating groundwater development. Early site reconnaissance and permitting activities prevent schedule delays from unexpected access problems or regulatory requirements emerging during implementation.
Network optimization techniques employ geostatistical methods, information theory, or numerical modeling evaluating alternative configurations for effectiveness in meeting monitoring objectives. Geostatistical approaches including kriging and variogram analysis quantify spatial correlation structures guiding well placement for desired interpolation accuracy across study areas. Information entropy methods evaluate how different network configurations reduce uncertainty about aquifer quality conditions. Groundwater flow and transport modeling simulates contaminant migration predicting where monitoring wells most effectively detect releases or characterize plume extent. Optimization analyses typically consider multiple objectives potentially including minimizing total network cost, maximizing spatial coverage, ensuring early detection capabilities, and achieving acceptable uncertainty levels, with multi-criteria decision analysis balancing competing objectives through weighted scoring approaches. Iterative network refinement adjusts initial designs based on data collected identifying areas requiring additional coverage, wells providing redundant information, or sampling frequencies exceeding necessary temporal resolution for observed variability patterns.
Monitoring Well Construction Standards and Specifications
Monitoring well construction requires meticulous attention to specifications ensuring long-term integrity and sample representativeness over monitoring program lifespans potentially extending decades. Construction quality fundamentally affects data quality with deficiencies potentially causing biased results from surface water infiltration through inadequate seals, cross-contamination between aquifer zones from improper well completion, or poor hydraulic communication from insufficient development or inappropriate filter pack design. International standards including ASTM D5092 (Design and Installation of Ground Water Monitoring Wells), ISO 5667-11 (Water quality — Sampling — Guidance on sampling of groundwaters), British Standard BS 5930 (Code of practice for site investigations), and various national guidelines provide detailed specifications addressing materials selection, installation procedures, quality control, documentation, and post-construction evaluation ensuring wells meet technical requirements for representative groundwater sampling.
Borehole advancement method selection considers formation characteristics, required depth, sample quality needs, and equipment availability. Hollow-stem auger drilling provides common method for unconsolidated formations enabling continuous observation of drilling progress, collection of formation samples, and well installation without introducing drilling fluids potentially contaminating monitor wells. Direct-push methods including Geoprobe or cone penetrometer testing offer rapid small-diameter well installation in unconsolidated materials to moderate depths (typically under 30 meters) suitable for shallow monitoring networks where numerous wells required. Mud rotary drilling accommodates challenging conditions including consolidated formations, cobbles, or greater depths, though drilling fluid use necessitates thorough well development removing mud invasion before representative sampling possible. Air rotary drilling avoids fluid contamination concerns and provides rapid penetration in consolidated formations but requires dust control and produces large cuttings volumes. Method selection balances technical requirements against costs with hollow-stem auger and direct-push generally most economical for typical monitoring well applications in unconsolidated aquifers.
Monitoring Well Construction Specifications:
Casing and Screen Materials:
• PVC (polyvinyl chloride): Most common for general monitoring, chemically inert, economical (Schedule 40 or 80)
• Stainless steel: Required for organic compound sampling preventing sorption/leaching, expensive but durable
• HDPE (high-density polyethylene): Alternative to PVC, flexible, resistant to stress cracking
• Teflon (PTFE): Specialized applications requiring maximum chemical resistance, very expensive
• Material compatibility: Selection considers target analytes avoiding materials interacting with contaminants
• Diameter: Typically 50-100 mm (2-4 inch) for monitoring wells balancing sample volume with installation cost
• Screen slot size: Based on filter pack gradation, typically 0.25-0.50 mm (0.010-0.020 inch) slots
Screen Interval and Filter Pack:
• Screen length: 1-3 m for discrete intervals, 3-10 m for integrated aquifer sampling
• Screen type: Continuous slot, machine slotted, or wire-wrapped providing open area 8-12% minimum
• Filter pack material: Rounded silica sand or gravel, chemically inert, uniform gradation
• Filter pack sizing: Grain size selected retaining 90% formation material while maximizing permeability
• Typical sizing: 1-2 mm (12-20 mesh) sand for fine formations, 2-4 mm (6-12 mesh) for coarse formations
• Filter pack thickness: 75-150 mm (3-6 inch) annular thickness surrounding screen
• Placement method: Tremie or hollow-stem auger ensuring continuous pack without bridging or segregation
Annular Seals and Surface Completion:
• Bentonite seal: 0.5-1.5 m thickness above filter pack preventing vertical migration along well bore
• Bentonite type: Granular or pellet bentonite hydrating to form low-permeability seal (pellets preferred preventing bridging)
• Cement grout: Portland cement or bentonite-cement mixture filling annular space above bentonite seal
• Grout placement: Tremie method from bottom of seal interval upward ensuring complete annular filling
• Surface seal: Concrete pad extending 0.5-1 m radius sloped away from well preventing ponding
• Protective casing: Steel or PVC outer casing extending 0.5-1 m above grade protecting well from damage
• Well cap: Locking cap preventing unauthorized access, contamination entry, vandalism
• Well identification: Permanent tag or label with unique well identifier, installation date, depth information
Well Development Procedures:
• Development objective: Remove drilling fluids, sediment, fine particles enabling representative groundwater flow
• Development methods: Surging with surge block or bailer, over-pumping with submersible or peristaltic pump
• Development criteria: Continue until water clarity improves, turbidity <10 NTU, stabilized field parameters
• Development volume: Typically 5-10 well volumes minimum or until acceptance criteria achieved
• Waste disposal: Properly dispose development water based on anticipated quality (discharge permit or containerization)
• Post-development waiting: Allow 24-48 hours recovery before initial sampling enabling formation equilibration
• Documentation: Record development method, duration, volumes removed, final water quality parameters
Filter pack design follows established principles ensuring adequate hydraulic communication between well screen and formation while preventing sediment entry causing well efficiency decline and sample turbidity. Filter pack grain size selection typically employs uniformity coefficient method analyzing formation grain size distribution from sieve analysis, selecting pack material retaining 90% formation material based on D10 size (grain diameter where 10% of sample by weight is finer). For uniform formations, filter pack typically 4-6 times formation D50 grain size. For non-uniform formations, more complex analysis required considering formation uniformity coefficient and targeting pack permeability 10-20 times formation permeability. Properly designed filter packs prevent sand pumping while maximizing well yield enabling low-stress sampling without excessive drawdown mobilizing sediment. Filter pack emplacement requires care ensuring continuous placement without bridging (voids in pack) or segregation (size sorting during placement) either of which compromises hydraulic performance.
Annular sealing prevents surface water or shallow contaminated groundwater from migrating down well bore short-circuiting natural flow paths and contaminating deeper monitoring intervals. Primary seal consisting of bentonite pellets or granules placed immediately above filter pack forms low-permeability barrier isolating screen interval from overlying formations. Bentonite requires hydration period (typically 12-24 hours) before grout placement above allowing clay swelling and seal formation. Cement-bentonite grout mixture (typical ratio 5-10% bentonite by weight of cement) fills remaining annular space from top of bentonite seal to ground surface, with neat cement alternatively used in some applications. Grout emplacement via tremie method (tubing extending to bottom of interval being grouted) ensures complete filling without bridging or voids that compromise seal integrity. Surface completion including concrete pad, protective outer casing extending above grade, and lockable well cap prevents damage from surface activities, unauthorized access, and direct contamination entry.
Monitoring Well Construction Diagram and Specifications

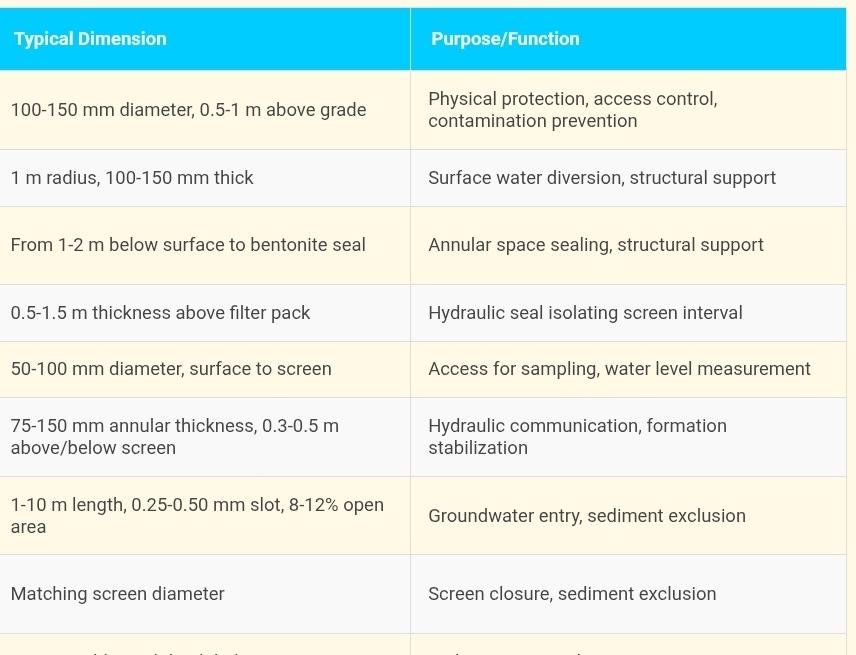
Note: Specifications represent typical values for monitoring wells in unconsolidated aquifers. Site-specific conditions may require modifications. Consult ASTM D5092, ISO 5667-11, or national standards for detailed construction guidance. Professional hydrogeologist should oversee well design and installation ensuring specifications appropriate for local conditions and monitoring objectives.
Well development constitutes critical step removing drilling impacts enabling representative groundwater sampling. Development removes drilling fluid invasion, fine particles mobilized during installation, and bentonite or grout infiltration into filter pack, restoring natural hydraulic communication between aquifer and well screen. Development methods include surging creating alternating flow into and out of well mobilizing fine particles, over-pumping removing substantial volumes at rates exceeding intended sampling rates, or mechanical agitation using development tools. Development continues until acceptance criteria achieved typically including turbidity below 10 NTU (Nephelometric Turbidity Units), field parameters (pH, conductivity, temperature) stabilized within 10% over several well volumes, and visual observation of clear water production. Development water disposal requires proper management with anticipated water quality determining whether discharge allowable under environmental regulations or containerization and treatment necessary for contaminated wells.
Well construction documentation includes borehole log recording lithology encountered during drilling, well construction diagram showing component depths and dimensions, materials inventory documenting casing, screen, filter pack, and seal materials used, development record noting methods and results, survey data providing well location coordinates and top-of-casing elevation, and photographic documentation showing installation progress and final completion. Well database entry captures essential information including unique identifier, location, total depth, screen interval depth, casing diameter, installation date, purpose, and hydrogeologic unit screened. Proper documentation enables future well location, supports data interpretation through understanding well construction details, and facilitates well maintenance or abandonment when monitoring program concludes. Many jurisdictions require well installation reporting to water resource agencies maintaining registries of monitoring and production wells within their administrative areas.
Low-Flow Groundwater Sampling Protocols and Procedures
Low-flow purging and sampling methodology revolutionized groundwater sampling practices during 1990s-2000s replacing traditional high-volume purging with controlled low-rate pumping minimizing sample disturbance while achieving representative formation water chemistry. Traditional methods typically removed 3-5 well volumes before sample collection through high-rate pumping causing substantial drawdown, sediment mobilization, and mixing of stagnant well bore water with formation water entering well during pumping. Low-flow approach instead employs pumping rates typically 0.1-0.5 liters per minute generating minimal drawdown (ideally under 0.1 meter), maintaining natural flow conditions, and allowing representative formation water sampling once field parameters stabilize indicating purge water replacement by formation water. International guidance including US EPA Region 1 Low Stress (Low Flow) Purging and Sampling Procedure, Interstate Technology Regulatory Council technical guidance, and various national protocols established this approach as best practice for groundwater quality monitoring reducing sample variability, preventing artificial turbidity, and improving sample representativeness.
Field parameter monitoring constitutes essential component of low-flow sampling providing real-time indication of water quality stabilization signaling appropriate sampling timing. Continuous measurement of pH, temperature, specific conductance (electrical conductivity), dissolved oxygen, oxidation-reduction potential (ORP), and turbidity using flow-through cell minimizes atmospheric exposure and enables stabilization assessment. Stabilization criteria typically require three consecutive readings with variations not exceeding: pH ±0.1 units, temperature ±0.5°C, conductivity ±5%, dissolved oxygen ±10%, ORP ±10 mV, turbidity ±10% (or absolute value if low). Field parameter stabilization typically occurs within 20-60 minutes of low-flow pumping though variable depending on well construction, formation hydraulic conductivity, and previous purging history. Monitoring parameter trends rather than absolute values enables recognition of approaching stabilization with graphical presentation facilitating visual identification of plateau indicating formation water recovery suitable for sample collection.
Low-Flow Sampling Procedure Step-by-Step:
Pre-Sampling Preparation:
• Review sampling and analysis plan identifying well sampling order, parameters, QC samples
• Prepare equipment: pump, tubing, flow-through cell, field instruments, sample containers
• Calibrate field instruments (pH, conductivity, DO, ORP meters) using fresh standards
• Organize sample containers confirming proper preservatives, labels, chain-of-custody forms
• Decontaminate re-usable equipment following written procedures (typically Alconox/water rinse, deionized water rinse)
• Verify cooler ice/gel packs adequate for temperature maintenance during transport
• Don personal protective equipment appropriate for site conditions and potential contaminants
Well Preparation and Pump Placement:
• Measure static water level using electronic or acoustic water level indicator, record measurement
• Calculate total well depth, screen interval depth, initial water column volume
• Lower pump intake to mid-screen interval position (avoid bottom to prevent sediment intake)
• Record pump depth and water level stabilization time before pumping commences
• Connect tubing ensuring minimal dead volume, avoid kinks or air pockets
• Attach tubing to flow-through cell for field parameter monitoring with minimal turbulence
• Pre-wet tubing and flow-through cell eliminating air from system before flow initiation
Low-Flow Purging and Monitoring:
• Initiate pumping at low rate (typically 0.1-0.5 L/min) observing drawdown with water level indicator
• Adjust flow rate if necessary maintaining drawdown <0.1 m (preferably <0.05 m)
• Monitor field parameters continuously recording values at regular intervals (typically 3-5 minutes)
• Calculate purge volume removed for documentation (flow rate × time)
• Continue purging until stabilization criteria achieved for all monitored parameters
• Typical stabilization time: 20-60 minutes, may extend longer for low-permeability formations
• Document final field parameters, total purge volume, drawdown, flow rate at sampling
Sample Collection and Preservation:
• Collect samples directly from discharge tubing avoiding excessive aeration
• Fill volatile organic containers first minimizing headspace, immediately cap and preserve
• Follow parameter-specific filling order: VOCs, metals, general chemistry, other parameters
• Add preservatives as required (acid for metals, no headspace for VOCs, refrigeration for all)
• Fill containers to appropriate levels leaving headspace only when specified by method
• Label samples immediately with well ID, date, time, sampler initials
• Place samples in cooler with ice/gel packs targeting 4°C temperature maintenance
• Collect field QC samples (duplicates, blanks) as specified in sampling plan
Post-Sampling Activities:
• Record final water level measurement documenting recovery
• Decontaminate equipment before moving to next well preventing cross-contamination
• Properly dispose purge water (discharge if acceptable, containerize if contaminated)
• Complete field forms: well purge record, field parameter logs, sample collection forms
• Initiate chain-of-custody documentation recording sample transfer to laboratory
• Verify cooler temperature meeting method requirements (<6°C) before transport
• Photograph well head, sampling equipment setup, QC documentation (optional but recommended)
Pump selection for low-flow sampling considers required flow rate, pumping depth, sample parameter requirements, and equipment durability. Bladder pumps provide excellent sample quality through minimal aeration and contamination risk suitable for volatile organics sampling, though requiring compressed gas source and somewhat complex operation. Peristaltic pumps offer simple operation and easy decontamination with practical depth limit approximately 8 meters due to suction lift constraints. Submersible pumps including low-flow models accommodate deeper applications and high water levels, with stainless steel construction preferred for organic sampling and plastic acceptable for metals and general chemistry. Pump tubing selection avoids materials potentially leaching or sorbing target analytes, with polyethylene, polypropylene, or Teflon preferred depending on contaminants of concern. Dedicated pumps installed permanently in wells eliminate cross-contamination concerns and setup time though requiring higher initial costs and periodic maintenance.
Sample preservation and handling follow strict protocols preventing contamination or degradation before laboratory analysis. Volatile organic samples require zero-headspace filling, immediate preservation with hydrochloric acid to pH <2, and refrigeration to 4°C, with 14-day holding time from collection to analysis. Metal samples receive nitric acid preservation to pH <2, refrigeration, and typically 6-month holding time (except mercury 28 days). General chemistry samples including anions, nutrients, and major ions require refrigeration without chemical preservation, with holding times varying from 48 hours for some nutrients to 28 days for common ions. Microbiological samples demand immediate refrigeration, rapid transport to laboratory, and analysis within 6-30 hours depending on test method. Sample container types vary from glass for organics, plastic for metals and inorganics, to sterile plastic or glass for microbiology. Pre-cleaned, certified containers from laboratory supply vendors prevent contamination from container residues.
Sample Preservation and Holding Time Requirements

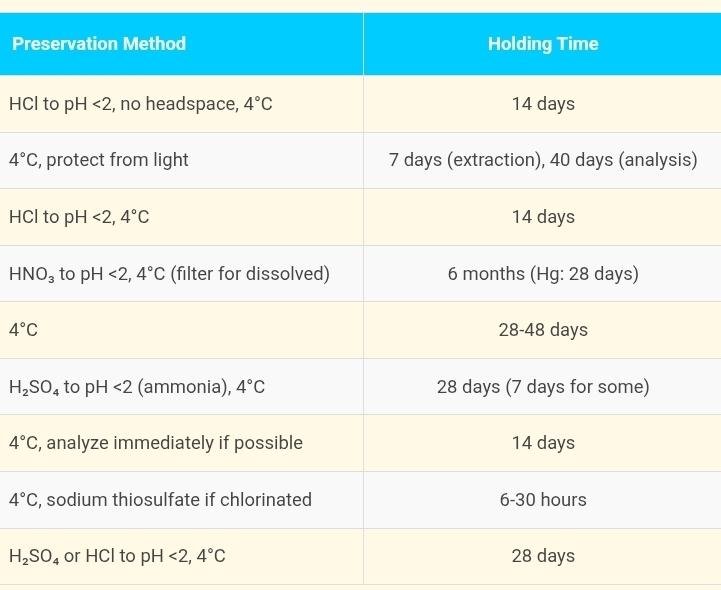
Note: Holding times represent maximum intervals from sample collection to analysis ensuring result validity. Shorter holding times preferred when practical. Preservation requirements vary by analytical method; consult laboratory for specific requirements. Filtered samples for dissolved metals or nutrients require field filtration immediately upon collection using 0.45 μm membrane filters.
Quality control samples incorporated into sampling program verify data reliability and identify potential problems affecting interpretation. Field duplicate samples collected from same well immediately following primary sample assess sampling and analytical precision, with relative percent difference calculations quantifying variability. Equipment blanks prepared by running deionized water through decontaminated sampling equipment detect contamination from incomplete cleaning procedures. Trip blanks accompanying volatile organic samples monitor contamination during transport and storage, with laboratory-prepared blanks traveling to field and back without opening. Field blanks prepared on-site by pouring source water into sample containers detect ambient contamination from field conditions, equipment, or handling procedures. Matrix spike/matrix spike duplicate samples (typically laboratory-prepared rather than field) assess analytical accuracy and precision in environmental matrices potentially affecting recovery.
Chain-of-custody documentation provides legal defensibility and quality assurance tracking sample possession from collection through analysis and disposal. Chain-of-custody forms record well identification, sample collection date and time, sampler name, analytical parameters requested, preservation methods, relinquishment and receipt signatures documenting custody transfers, and special handling requirements. Sample coolers sealed with custody tape indicating tampering if broken maintain sample security during transport. Laboratory receipt confirmation with custody form review verifies sample integrity before analysis proceeds. Electronic chain-of-custody systems increasingly common provide real-time tracking, digital signatures, and automated laboratory information management system integration streamlining documentation while maintaining legal defensibility required for regulatory compliance or litigation support applications.
Analytical Methods and Laboratory Quality Control
Laboratory analytical methods selection depends on monitoring program objectives, required detection limits, regulatory requirements, and budget constraints. Standard methods developed by EPA (Environmental Protection Agency), Standard Methods for Examination of Water and Wastewater, ASTM, ISO, and other standards organizations provide validated procedures ensuring reliable, reproducible results. Method selection considers multiple factors including analyte applicability (whether method targets compounds of concern), detection limits adequate for comparison to relevant standards or background levels, matrix interference potential from sample composition, throughput requirements for large sample batches, and cost per sample affecting program economics. Laboratories typically offer multiple methods for common parameters (e.g., several metal analysis methods with different detection limits and costs), requiring careful selection matching program needs against budget constraints.
General chemistry parameters including pH, conductivity, total dissolved solids, alkalinity, hardness, and major ions provide fundamental water type characterization essential for data interpretation. Field pH measurement using calibrated pH meter provides immediate results though laboratory confirmation using standardized procedures (typically EPA 150.1 or Standard Methods 4500-H⁺) ensures quality control. Specific conductance measured in field or laboratory quantifies total dissolved ion concentration correlating with total dissolved solids. Major cation analysis (calcium, magnesium, sodium, potassium) and anion analysis (chloride, sulfate, bicarbonate, carbonate) using ion chromatography, inductively coupled plasma methods, or wet chemistry techniques enables water type classification, ion balance calculation verifying analytical quality, and geochemical process understanding through graphical presentations including Piper diagrams or Stiff patterns.
Common Analytical Methods for Groundwater Monitoring:
Volatile Organic Compounds:
• EPA 8260 / ISO 15680: Gas chromatography-mass spectrometry (GC-MS) for VOCs including BTEX, chlorinated solvents, fuel oxygenates
• Detection limits: Typically 0.5-1 μg/L for most compounds, lower for some carcinogens
• Sample volume: 40 mL preserved in zero-headspace vials
• Advantages: Comprehensive compound library, confirmatory identification through mass spectra
• Typical cost: USD 150-300 per sample for full VOC scan
Semi-Volatile Organic Compounds:
• EPA 8270: GC-MS for SVOCs including polynuclear aromatic hydrocarbons (PAHs), phthalates, phenols, pesticides
• Detection limits: Typically 5-10 μg/L depending on compound and matrix
• Sample preparation: Liquid-liquid extraction or solid-phase extraction concentrating analytes
• Hold time considerations: 7-day extraction, 40-day analysis from extraction date
• Typical cost: USD 200-400 per sample for comprehensive SVOC analysis
Metals Analysis:
• EPA 200.8 / 6020: Inductively Coupled Plasma-Mass Spectrometry (ICP-MS) for trace metals at low detection limits
• EPA 200.7 / 6010: Inductively Coupled Plasma-Atomic Emission Spectrometry (ICP-AES) for metals at higher concentrations
• Detection limits: ICP-MS typically 0.1-1 μg/L, ICP-AES 5-100 μg/L depending on element
• Sample preparation: Acid digestion for total metals, filtration for dissolved metals
• Typical cost: USD 50-150 for standard metal suite (10-20 elements)
Nutrients and Anions:
• EPA 300.0: Ion chromatography for anions (nitrate, nitrite, sulfate, chloride, fluoride, bromide)
• EPA 350.1 / Standard Methods 4500-NH₃: Ammonia by colorimetry or selective electrode
• EPA 365.1: Phosphorus by colorimetric ascorbic acid method
• Detection limits: Typically 0.05-0.5 mg/L for ions, 0.01-0.05 mg/L for nutrients
• Typical cost: USD 15-30 per analyte
Petroleum Hydrocarbons:
• EPA 8015: Gas chromatography-flame ionization detector (GC-FID) for total petroleum hydrocarbons (TPH)
• Fractionation: Separate analysis of gasoline range (C6-C12), diesel range (C12-C28), oil range (C28-C40)
• Detection limits: Typically 50-100 μg/L depending on fraction
• Applications: Fuel contamination assessment, release detection, remediation monitoring
• Typical cost: USD 100-200 for fractionated TPH analysis
Laboratory quality control encompasses method blanks detecting contamination from reagents or equipment, laboratory control samples (LCS) verifying method accuracy with known standards, matrix spikes assessing matrix interference through spiked environmental samples, matrix spike duplicates evaluating precision, surrogate compounds monitoring extraction efficiency, and calibration verification ensuring instrument performance. Method blanks analyzed with every sample batch demonstrate absence of laboratory contamination affecting low-level detections. LCS recovery must fall within method-specified acceptable ranges (typically 80-120% for most parameters) confirming accurate quantitation. Matrix spike recovery evaluates whether sample matrix affects analyte measurement, with poor recovery indicating interference requiring corrective action like sample dilution, alternative sample preparation, or result qualification. Duplicate analysis provides precision assessment through relative percent difference calculation with acceptable limits typically ±20% for concentrations well above detection limits.
Detection and quantitation limits define analytical sensitivity crucial for regulatory comparison and trend detection. Method Detection Limit (MDL) represents minimum concentration detectable above background noise with 99% confidence, determined through statistical analysis of replicate low-concentration samples. Practical Quantitation Limit (PQL) represents lowest concentration reliably measured with specified precision and accuracy, typically 5-10 times MDL. Reporting limits established by laboratories based on method capabilities, calibration ranges, and routine performance may exceed MDLs when matrices or high sample loads affect practical detection. Laboratories should provide detection limits adequate for comparison to relevant standards, with requests for ultra-low detection limits potentially requiring specialized methods, extended analysis times, and premium pricing. Non-detect results reported as "less than reporting limit" with laboratory specifying actual limit used rather than generic "non-detect" lacking quantitative information needed for data analysis.
Data validation procedures implemented by environmental professionals reviewing analytical reports verify quality control acceptability, identify anomalous results, check calculation accuracy, confirm holding time compliance, and apply appropriate qualifiers communicating data limitations. Validation checklists systematically address required elements including custody documentation review, analytical method verification, QC sample result evaluation against acceptance criteria, holding time compliance verification, detection limit adequacy confirmation, and result reasonableness assessment through comparison with historical data or expected ranges. Data qualifiers applied following validation communicate specific limitations including "J" for estimated values below quantitation limit but above detection limit, "U" for non-detected compounds, "R" for rejected data failing QC criteria, and "H" for holding time exceedance. Validation reports documenting review process and decisions provide quality assurance record supporting data defensibility for regulatory compliance or legal applications.
Data Interpretation, Statistical Analysis, and Trend Assessment
Groundwater quality data interpretation transforms analytical results into meaningful information supporting management decisions through multiple analyses including comparison to standards or background levels, spatial pattern assessment, temporal trend evaluation, geochemical characterization, and conceptual model validation. Initial interpretation involves screening for exceedances of drinking water standards, environmental quality criteria, or site-specific action levels triggering investigation or response. Background comparison distinguishes anthropogenic contamination from natural water quality variability using statistical methods comparing monitored locations to upgradient background wells or historical baseline datasets. Spatial analysis through contour mapping, cross-sections, or three-dimensional visualization identifies contamination source areas, delineates plume extent, and supports remediation system design or optimization. Temporal analysis tracks quality changes over monitoring program duration identifying improving or degrading trends informing management effectiveness or emerging problems requiring attention.
Statistical summary measures characterize datasets through central tendency (mean, median), dispersion (standard deviation, range, interquartile range), and distribution shape. Mean values provide average concentration though sensitive to outliers potentially skewing results, while median values representing 50th percentile prove more robust for datasets with skewed distributions common in environmental data. Standard deviation quantifies variability with coefficients of variation (standard deviation divided by mean) enabling comparison across parameters with different units or concentration ranges. Box plots graphically present median, interquartile range, and outliers enabling visual dataset comparison across wells, time periods, or parameters. Summary statistics calculated carefully handling non-detect results through substitution methods (replace with half detection limit), distributional methods (maximum likelihood estimation), or specialized non-parametric methods avoiding bias from arbitrary non-detect treatment.
Statistical Methods for Groundwater Quality Data Analysis:
Descriptive Statistics:
• Central tendency: Mean, median, geometric mean for summary measures
• Dispersion: Standard deviation, variance, range, interquartile range quantifying variability
• Distribution assessment: Histograms, probability plots, skewness/kurtosis measures
• Outlier detection: Boxplots, z-scores, modified Z-scores identifying unusual values
• Non-detect handling: Substitution (½ DL), distributional methods, robust ROS (regression on order statistics)
• Confidence intervals: 95% confidence bounds on mean providing uncertainty estimates
• Percentile calculations: 10th, 25th, 50th, 75th, 90th, 95th percentiles characterizing distribution
Comparison Tests:
• Student's t-test: Compare means between two groups (background vs. compliance, pre vs. post remediation)
• ANOVA: Compare means across multiple groups or time periods
• Mann-Whitney U test: Non-parametric alternative to t-test for non-normal distributions
• Kruskal-Wallis test: Non-parametric alternative to ANOVA
• Paired t-test: Compare related samples (same well at different times, duplicates)
• Wilcoxon signed-rank: Non-parametric paired test
• Statistical power: Calculate required sample size or minimum detectable difference
Trend Analysis:
• Linear regression: Fit concentration vs. time relationship, test slope significance
• Mann-Kendall test: Non-parametric trend detection robust to seasonality and non-normality
• Sen's slope estimator: Robust trend magnitude estimation resistant to outliers
• Seasonal Kendall: Account for seasonal variability in trend assessment
• Step trend analysis: Detect abrupt changes rather than gradual trends
• Change point detection: Identify specific times when trend changes direction or magnitude
• Control charts: Statistical process control approach detecting out-of-control conditions
Spatial Analysis:
• Kriging: Geostatistical interpolation providing optimal unbiased prediction and uncertainty estimates
• Inverse distance weighting: Simple interpolation method weighting nearby points more heavily
• Thiessen polygons: Assign areas to monitoring points based on proximity
• Contour mapping: Visualize spatial patterns through isoconcentration lines
• Spatial autocorrelation: Moran's I or Geary's C quantifying spatial dependence
• Variogram analysis: Characterize spatial correlation structure guiding interpolation
• Cross-validation: Assess interpolation accuracy by predicting known locations
Trend analysis methods detect significant concentration changes over time distinguishing true trends from random variability. Linear regression fits concentration-time relationship with slope significance testing determining whether upward or downward trend exists at specified confidence level (typically 95%). Mann-Kendall test provides non-parametric alternative robust to non-normal distributions, outliers, and missing data, testing monotonic trend hypothesis without assuming linear relationship. Seasonal Kendall modification accounts for seasonal variability common in shallow groundwater affected by recharge patterns. Trend analysis applications include remediation performance assessment demonstrating contaminant decline, early warning detection identifying emerging contamination requiring investigation, background trend evaluation distinguishing natural evolution from impacts, and regulatory compliance verification demonstrating restoration goal achievement. Trend detection power depends on dataset length (longer records enable detection of weaker trends), variability (higher variability requires stronger trends for statistical significance), and sampling frequency (more frequent sampling improves temporal resolution).
Geochemical characterization utilizes major ion chemistry, stable isotopes, and diagnostic ratios identifying water sources, geochemical processes, and contamination signatures. Piper diagrams plotting major ion percentages classify water types (calcium-bicarbonate, sodium-chloride, mixed types) indicating flow paths and geochemical evolution. Stiff diagrams presenting ion concentrations in characteristic patterns enable visual comparison across wells identifying similar or distinct water compositions. Saturation index calculations using geochemical modeling software (PHREEQC, MINTEQ) predict mineral precipitation or dissolution processes affecting water chemistry. Redox indicators including dissolved oxygen, nitrate, iron, manganese, and sulfate sequence characterize geochemical conditions affecting contaminant fate with implications for remediation approaches. Isotopic signatures from deuterium, oxygen-18, carbon-13, or tritium provide insights into recharge sources, residence times, and mixing processes distinguishing different water masses or contamination sources.
Monitoring Program Quality Assurance and Documentation
Quality assurance program elements ensure monitoring generates reliable, defensible data supporting intended uses through systematic planning, implementation controls, and documentation practices. Quality Assurance Project Plan (QAPP) developed before sampling commences defines data quality objectives, sampling and analysis procedures, quality control requirements, data management practices, and assessment processes. Data Quality Objectives (DQOs) specification articulates precision, accuracy, representativeness, completeness, and comparability (PARCC parameters) requirements matching program needs. Precision requirements typically expressed as relative percent difference or relative standard deviation specify acceptable variability in duplicate measurements. Accuracy targets through laboratory control samples define acceptable recovery ranges. Representativeness considers sampling methods ensuring collected samples reflect actual groundwater conditions. Completeness goals specify minimum acceptable percentages of valid data (typically 90-95%). Comparability requirements address consistency enabling data comparison across time periods, laboratories, or programs.
Standard Operating Procedures (SOPs) provide detailed written protocols for critical activities including equipment decontamination, well development and sampling, field parameter measurement, sample handling and preservation, chain-of-custody procedures, equipment calibration and maintenance, and data management. SOPs ensure procedural consistency across personnel, time periods, and locations reducing variability from methodological differences. Regular SOP review and updates incorporate lessons learned, procedural improvements, and regulatory requirement changes maintaining current guidance. Personnel training programs ensure staff competency in SOP implementation through classroom instruction, field demonstrations, and supervised practice before independent work authorization. Competency verification through field audits, performance testing, or certification programs demonstrates personnel capabilities performing assigned duties meeting quality standards.
Quality Assurance Program Components:
Quality Assurance Project Plan Elements:
• Project description: Background, objectives, scope, schedule, organization
• Data quality objectives: PARCC parameters (precision, accuracy, representativeness, completeness, comparability)
• Sampling design: Network configuration, locations, frequency, parameters
• Sampling procedures: Field methods, equipment, QC samples, documentation
• Analytical methods: Laboratory selection, methods, detection limits, QC requirements
• Quality control: Field and laboratory QC samples, acceptance criteria, corrective actions
• Data management: Database design, validation procedures, reporting formats
• Assessment and oversight: Audits, performance evaluations, corrective action processes
Standard Operating Procedures:
• Equipment decontamination: Cleaning procedures, rinse sequence, verification methods
• Well development: Methods, acceptance criteria, waste disposal
• Water level measurement: Equipment, techniques, documentation
• Low-flow sampling: Pump operation, parameter monitoring, stabilization criteria
• Sample preservation: Preservatives, container selection, temperature control
• Field measurements: Calibration procedures, measurement protocols, documentation
• Chain of custody: Form completion, custody transfers, security
• Equipment maintenance: Calibration schedules, repair procedures, replacement criteria
Documentation Requirements:
• Field logbooks: Date, time, personnel, weather, observations, measurements
• Well purge records: Purge method, volumes, flow rates, drawdown, field parameters
• Sample collection forms: Well ID, date/time, parameters, preservation, samplers
• Chain of custody: Sample tracking from collection through analysis
• Calibration records: Equipment calibration dates, standards, results
• Decontamination logs: Equipment cleaned, procedures followed, verification
• Photographic documentation: Well conditions, equipment setup, activities
• Laboratory reports: Analytical results, QC data, certifications, qualifications
Performance Assessment:
• Internal audits: Regular review of procedures, documentation, data quality
• External audits: Third-party assessment of program compliance with requirements
• Performance evaluation samples: Blind samples testing laboratory analytical capabilities
• Field audits: Direct observation of field procedures verifying SOP compliance
• Data quality assessment: Quantitative evaluation of data meeting DQO requirements
• Corrective action: Procedures identifying, documenting, correcting problems
• Management review: Periodic program effectiveness evaluation, improvement identification
Data management systems organize, validate, store, and retrieve monitoring data supporting analysis and reporting. Database design accommodates well information (location, construction, hydrogeologic unit), water level measurements, field parameters, analytical results, quality control data, and associated metadata (sampling dates, personnel, methods, laboratories). Relational database structure with appropriate quality control constraints prevents data entry errors through validation rules, required field enforcement, and referential integrity maintaining relationships across tables. Electronic data deliverables from laboratories in standard formats (EDD) enable automated database import reducing transcription errors from manual entry. Data validation flags and qualifiers applied during review process stored with analytical results preserving quality information affecting interpretation. Data backup and security procedures prevent loss from hardware failures, provide disaster recovery capabilities, and restrict access to authorized personnel maintaining data integrity.
Reporting formats communicate monitoring results to diverse audiences including technical specialists requiring detailed analytical results, regulators evaluating compliance with permit requirements, management needing executive summaries supporting decisions, and affected communities deserving accessible presentation of findings. Technical reports typically include executive summary, introduction with objectives and background, methods description, results presentation through tables and figures, data interpretation and discussion, conclusions and recommendations, and appendices with detailed data tables. Graphical presentations including time-series plots, spatial maps, box plots, and concentration profiles convey information more effectively than data tables alone. Regulatory reporting follows specified formats and schedules defined in permits or regulations ensuring compliance documentation. Annual monitoring reports synthesizing year's results identifying trends and recommendations prove common requirement for many programs.
Monitoring Well Maintenance and Long-Term Stewardship
Monitoring well maintenance ensures continued functionality over program lifetimes potentially extending decades requiring periodic inspection, rehabilitation when necessary, and eventual abandonment when monitoring objectives conclude. Well inspection during sampling events documents physical condition including protective casing damage, cap security, surface seal integrity, and above-ground infrastructure. Annual comprehensive inspections systematically evaluate well conditions using standardized checklists documenting problems requiring corrective action. Common maintenance issues include damaged protective casing from vehicle impacts or vandalism, deteriorated surface seals allowing surface water infiltration, vegetation growth impeding access, and sediment accumulation in well reducing available sampling depth. Preventive maintenance activities including vegetation control, surface seal repairs, and protective casing repainting preserve well integrity avoiding more expensive rehabilitation needs.
Well rehabilitation addresses declining performance from sediment accumulation, biological fouling, chemical encrustation, or mechanical damage requiring intervention restoring sampling functionality. Development procedures similar to initial well construction development including surging, jetting, or pumping remove accumulated sediment or biological growth. Chemical treatment using acids, disinfectants, or dispersants dissolves mineral encrustation or kills biofouling organisms though requiring proper waste disposal and potential sample schedule disruption during treatment chemical removal. Video logging using downhole cameras identifies specific problems including screen damage, casing failures, or excessive sediment guiding targeted rehabilitation approaches. Well redevelopment frequency depends on site conditions with some wells requiring annual intervention while others remain functional for decades without rehabilitation. Cost-benefit analysis weighs rehabilitation expenses against new well installation when rehabilitation proves repeatedly necessary or well condition deterioration suggests limited remaining service life.
Monitoring Well Maintenance and Abandonment:
Routine Inspection Items:
• Protective casing: Check for damage, corrosion, proper height above grade
• Well cap: Verify locking cap security, gasket condition, prevent unauthorized access
• Surface seal: Inspect concrete pad for cracks, settling, proper drainage slope
• Above-ground labels: Ensure well identification visible, legible, secure attachment
• Access: Verify clear access path, remove vegetation or obstacles
• Measurement point: Confirm top-of-casing survey marker intact
• Security: Note evidence of tampering, vandalism, or unauthorized access
Well Rehabilitation Techniques:
• Mechanical development: Surging, jetting, or brushing to remove sediment and biofouling
• High-velocity jetting: Water or air jetting dislodging encrustation and sediment
• Chemical treatment: Acid treatment for mineral scale, chlorine for biological growth
• Video logging: Downhole camera inspection identifying specific problems
• Air lifting: Compressed air removing sediment accumulation from well bottom
• Bailing: Manual removal of sediment using bailer
• Replacement: New screen installation if damage beyond rehabilitation
Well Abandonment Procedures:
• Regulatory notification: Obtain permits, follow abandonment requirements
• Documentation: Final well survey, abandonment record, photographs
• Sediment/water removal: Empty well before grouting preventing voids
• Grout placement: Tremie grouting from bottom upward with bentonite-cement or neat cement
• Screen removal: Pull screen and casing where feasible, abandon in place if not
• Surface restoration: Remove above-ground structures, restore grade, vegetation
• Record filing: Submit abandonment documentation to regulatory agencies, property records
Well abandonment becomes necessary when monitoring objectives conclude, property redevelopment prevents well preservation, well condition deteriorates beyond economic rehabilitation, or network optimization eliminates redundant locations. Proper abandonment prevents wells from serving as contamination pathways connecting aquifers or allowing surface contamination migration to depth. Abandonment procedures typically include regulatory notification and permit acquisition, complete grout filling from well bottom to surface, removal of above-ground structures, and surface restoration to pre-existing grade. Grout placement via tremie method ensures continuous fill without voids that could allow vertical migration. Abandonment documentation filed with water resource agencies prevents future water supply drilling inadvertently penetrating abandoned well causing cross-contamination between aquifers. Property deed annotations or environmental site assessments record abandoned well locations preventing future construction impacts or creating awareness for property transfer due diligence.
Frequently Asked Questions About Groundwater Quality Monitoring
1. How many monitoring wells are needed for adequate groundwater quality assessment?
Required well numbers depend on monitoring objectives, site size, hydrogeologic complexity, and spatial variability requiring assessment. Regional aquifer programs may employ one well per tens to hundreds of square kilometers providing broad coverage with limited spatial resolution, suitable for characterizing general water quality status and identifying areas requiring detailed investigation. Contamination plume delineation requires closer spacing with transects perpendicular to groundwater flow at 50-200 meter intervals defining lateral and vertical extent, while source area monitoring employs dense networks (10-30 meter spacing) characterizing contamination distribution guiding remediation design. Statistical design approaches utilizing geostatistical methods determine optimal well density for desired interpolation accuracy balancing information value against installation and sampling costs. Minimum requirements typically include at least one upgradient background well, adequate downgradient coverage detecting potential releases, and sufficient replication enabling statistical comparison and temporal trend analysis with reasonable confidence levels.
2. What sampling frequency is appropriate for groundwater quality monitoring?
Sampling frequency depends on monitoring objectives, expected temporal variability, regulatory requirements, and budget constraints. Baseline characterization typically employs quarterly sampling first year establishing seasonal variability understanding followed by reduced frequency for stable parameters showing minimal temporal variation. Contamination detection monitoring often requires quarterly to semi-annual sampling enabling timely problem identification before significant plume migration. Regulatory compliance programs follow permit-specified frequencies typically annual for stable aquifer systems or quarterly for facilities requiring more intensive surveillance. Remediation performance monitoring during active treatment may require monthly to quarterly sampling tracking contaminant reduction rates guiding system optimization. Statistical power analysis determines minimum sampling frequency detecting specified magnitude changes at desired confidence levels within acceptable timeframes. Adaptive sampling strategies adjust frequency based on observed variability with stable parameters sampled less frequently while parameters showing trends or high variability receiving more intensive monitoring.
3. How should monitoring programs handle non-detect results in statistical analysis?
Non-detect results (measurements below laboratory detection limits) require careful statistical treatment avoiding bias from arbitrary substitution methods. Simple substitution approaches replacing non-detects with zero, detection limit, or half detection limit provide expedient calculation but introduce bias affecting means, standard deviations, and trend analysis particularly when non-detect percentages exceed 15-20%. Preferred methods include regression on order statistics (ROS) combining parametric distribution assumptions for detected values with non-parametric treatment of non-detects, maximum likelihood estimation fitting distributional parameters accounting for censoring, or Kaplan-Meier methods from survival analysis adapted to environmental data. Non-parametric methods including median calculations, percentile estimation, or rank-based tests (Mann-Whitney, Kruskal-Wallis) handle non-detects without substitution assumptions. Reporting practices should clearly communicate non-detect frequencies, actual detection limits used (not generic <DL), and statistical methods employed enabling data users understand limitations and appropriately interpret results.
4. What is minimum required distance between monitoring wells and potential contamination sources?
Well placement relative to potential sources depends on monitoring objectives whether detecting releases, characterizing existing contamination, or demonstrating background conditions. Detection monitoring places wells sufficiently close to sources enabling timely detection before significant migration, typically 30-100 meters downgradient depending on aquifer velocity, source size, and acceptable detection timeframe. Regulatory programs may specify minimum/maximum distances balancing early detection against practical well placement constraints. Source characterization wells positioned immediately adjacent to or within source areas (underground storage tanks, waste disposal areas) define maximum concentrations and provide data for contaminant mass estimates. Background or upgradient wells require sufficient distance from all potential sources ensuring samples represent unaffected groundwater, typically minimum 30-50 meters though greater distances necessary if multiple sources surround site. Numerical groundwater flow modeling can simulate contaminant transport from sources predicting arrival times at alternative well locations optimizing placement for detection objectives while considering practical installation constraints and access limitations.
5. How can monitoring programs demonstrate statistical significance of temporal trends?
Trend detection requires sufficient temporal datasets (typically minimum 8-12 measurements), appropriate statistical methods, and consideration of temporal autocorrelation and seasonality affecting groundwater quality. Mann-Kendall test provides robust non-parametric trend detection without assuming normal distribution or linear relationship, testing monotonic trend hypothesis with Sen's slope estimator quantifying trend magnitude. Seasonal Kendall modification accounts for systematic seasonal variability common in shallow groundwater influenced by recharge patterns, preventing false trend detection from sampling time biases. Linear regression with autocorrelation adjustment addresses serial correlation violating independent error assumptions in standard regression. Required dataset length depends on variability magnitude and trend strength, with high variability requiring longer records or stronger trends achieving statistical significance. Power analysis calculates minimum detectable trends given dataset characteristics, sampling frequency, and desired confidence levels informing monitoring design decisions. Trend confidence assessment should consider practical significance (magnitude of change) alongside statistical significance (likelihood not due to chance) with small but statistically significant trends potentially lacking practical importance for management decisions.
6. What field parameters require measurement during groundwater sampling and why?
Essential field parameters measured during low-flow sampling include pH (7-9 typical range), temperature (10-20°C shallow groundwater), specific conductance (50-5000 μS/cm variable by geology), dissolved oxygen (0-10 mg/L indicating redox), oxidation-reduction potential (-200 to +400 mV redox indicator), and turbidity (<10 NTU target for representative samples). These parameters change rapidly upon atmospheric exposure or storage requiring field measurement for accurate representation, unlike most chemical analytes remaining stable with proper preservation. Field parameter stabilization indicates formation water recovery during low-flow purging with typical criteria requiring pH ±0.1 units, temperature ±0.5°C, conductivity ±5%, dissolved oxygen ±10%, ORP ±10 mV, turbidity ±10% over three consecutive readings. Continuous monitoring using flow-through cells minimizes atmospheric contact enabling accurate real-time assessment. Field parameter data interpretation assists data quality assessment (conductivity-TDS relationship verification, charge balance evaluation), geochemical characterization (redox condition determination from DO and ORP), and temporal trend analysis (seasonal temperature variations, conductivity changes indicating water type shifts).
7. How should monitoring programs address potential contamination from well construction materials?
Material selection considers target analytes avoiding interactions affecting sample chemistry. PVC (polyvinyl chloride) most common monitoring well material proves suitable for metals and general chemistry but potentially problematic for organic compounds through leaching from plasticizers or sorption of hydrophobic organics. Stainless steel recommended for volatile and semi-volatile organic monitoring preventing sorption losses though potentially contributing metals (iron, chromium, nickel) to samples particularly in low-pH or corrosive conditions. HDPE (high-density polyethylene) provides alternative to PVC with reduced organic compound interaction. Teflon (PTFE) offers maximum chemical inertness though expensive limiting applications to specialized monitoring. Proper well development removes residues from construction materials though some interactions persist requiring consideration in data interpretation. Blank samples from new wells verify absence of contamination from construction materials before concluding detected compounds represent actual groundwater conditions. Equipment blanks using deionized water passed through sampling equipment distinguish well material contributions from sampling equipment or handling contamination. Material compatibility review during design phase prevents construction using materials incompatible with target analytes avoiding expensive well replacement or data qualification uncertainties.
8. What quality control sample frequencies provide adequate data quality verification?
Field quality control sample frequencies balance data quality verification needs against analytical costs typically constrained by program budgets. Standard frequencies include field duplicates one per 10-20 field samples (5-10% of total) assessing sampling and analytical precision, equipment blanks one per decontamination batch or daily when using non-dedicated equipment detecting contamination from cleaning procedures, trip blanks one per cooler containing volatile organic samples monitoring transport contamination, and field blanks one per sampling event or 5% of samples detecting ambient or handling contamination. Matrix spike/matrix spike duplicates typically specified as 5-10% of samples though often laboratory-prepared rather than field-collected assessing analytical accuracy and precision in environmental matrices. Regulatory programs may specify minimum QC sample frequencies superseding professional judgment. Statistical power analysis determines whether QC sample frequencies provide adequate precision estimate confidence for intended data uses. Adaptive QC strategies increase frequencies when problems identified until root causes corrected and acceptable performance demonstrated, while reducing frequencies for established programs with consistent quality performance optimizing resource allocation between routine QC and investigative sampling addressing program objectives.
9. How should programs evaluate whether monitoring wells remain representative of aquifer conditions?
Well representativeness assessment considers construction integrity, hydraulic communication with formation, and sample quality indicators. Annual well inspection documents physical condition with problems including damaged casing, deteriorated seals, or sediment accumulation indicating potential sampling issues requiring investigation or rehabilitation. Water level response during sampling provides hydraulic communication assessment with rapidly recovering water levels indicating good formation connection while slow recovery suggests well damage, inadequate development, or low-permeability conditions. Turbidity monitoring tracks sample quality with persistently elevated turbidity (>10 NTU) suggesting inadequate well development, formation instability, or inappropriate filter pack design affecting representativeness. Geochemical indicators including dissolved oxygen, pH, conductivity, and temperature compared to historical ranges identify unusual conditions potentially indicating surface water infiltration, well degradation, or sampling procedure problems. Statistical control charts plotting parameters versus time with upper/lower control limits detect out-of-range values triggering investigation. Video logging provides direct observation of well screen, casing, and filter pack conditions identifying specific problems including screen corrosion, biological fouling, or sediment accumulation guiding targeted rehabilitation. Well replacement becomes necessary when rehabilitation costs repeatedly incurred suggest fundamental construction problems or site conditions have changed eliminating original well's representativeness of current monitoring objectives.
10. What role does numerical groundwater modeling play in monitoring network design optimization?
Groundwater flow and transport modeling simulates subsurface processes predicting contaminant migration patterns, evaluating alternative monitoring configurations, and optimizing well placement for detection or characterization objectives. Flow models calibrated to observed water levels and aquifer properties simulate groundwater flow directions and velocities identifying potential contaminant pathways and travel times from sources to monitoring points. Particle tracking analysis delineates capture zones for existing wells assessing coverage adequacy or identifies optimal locations for additional wells maximizing plume interception probability. Transport modeling simulates contaminant migration accounting for advection, dispersion, and attenuation processes predicting concentration distributions over time evaluating whether proposed monitoring locations enable timely detection meeting program objectives. Monte Carlo simulation incorporating parameter uncertainty quantifies confidence in model predictions guiding monitoring design decisions balancing early detection capabilities against false alarm rates from natural variability. Network optimization algorithms evaluate thousands of potential configurations identifying designs maximizing information while minimizing costs subject to practical constraints including access limitations, regulatory requirements, and budget restrictions. Modeling provides quantitative basis for monitoring decisions though recognizing models represent simplified representations of complex systems requiring validation through actual field data and periodic refinement as conceptual understanding improves through monitoring program implementation.
Groundwater Monitoring Terminology - Quick Reference Glossary
Anisotropy: Directional variation in hydraulic properties affecting flow patterns
Aquifer: Water-bearing geological formation capable of yielding usable quantities of water
Aquitard: Low-permeability layer restricting groundwater flow between aquifers
Bentonite: Clay material used for well sealing and annular space isolation
Chain of Custody: Documentation tracking sample possession from collection to disposal
Conductivity (Specific Conductance): Water's ability to conduct electrical current, indicates dissolved ion concentration
Cone of Depression: Funnel-shaped water level decline around pumping well
Drawdown: Water level decline in well due to pumping
Filter Pack: Graded sand or gravel placed around well screen enhancing hydraulic communication
Flow-Through Cell: Equipment enabling continuous field parameter monitoring minimizing atmospheric exposure
Hydraulic Gradient: Water level elevation change per unit distance indicating flow direction
Hydraulic Conductivity: Aquifer property quantifying water transmission rate through porous media
Lithology: Physical characteristics of geological formations encountered during drilling
Low-Flow Sampling: Purging and sampling at minimal rates (0.1-0.5 L/min) achieving representativeness through parameter stabilization
Method Detection Limit (MDL): Minimum concentration detectable above background with 99% confidence
ORP (Oxidation-Reduction Potential): Measure of electron activity indicating geochemical redox conditions
Permeability: Formation property allowing fluid flow, related to hydraulic conductivity
Potentiometric Surface: Imaginary surface representing hydraulic head throughout aquifer
Purging: Removing stagnant well bore water before sample collection
Quality Control (QC) Sample: Duplicate, blank, or spiked sample verifying data quality
Recharge: Water addition to aquifer from precipitation, surface water, or artificial sources
Screen Interval: Slotted or perforated well section allowing groundwater entry
Specific Capacity: Well yield per unit drawdown indicating well efficiency
Static Water Level: Equilibrium water level in non-pumping well
Transmissivity: Product of hydraulic conductivity and aquifer thickness quantifying total water transmission capacity
Turbidity: Water cloudiness from suspended particles, measured in NTU units
Vadose Zone: Unsaturated zone between ground surface and water table
Well Development: Process removing drilling impacts enabling representative sampling
References and Technical Resources:
1. UN-IGRAC. (2024). Guidelines for the Assessment of Groundwater Quality.
https://www.un-igrac.org/sites/default/files/resources/files/GWQ_guidelines_2024.pdf
2. World Water Quality Alliance (WWQA). Guidelines for the Assessment of Groundwater Quality.
https://wwqa.info/wp-content/uploads/2023/08/WWQA_FoG_Guidelines-for-the-assessment-of-groundwater-quality.pdf
3. European Commission. (2006). Groundwater Monitoring Guidance - Water Framework Directive.
https://circabc.europa.eu/sd/a/e409710d-f1c1-4672-9480-e2b9e93f30ad/Groundwater%20Monitoring%20Guidance%20Nov-2006_FINAL-2.pdf
4. United States Geological Survey (USGS). Framework for a Ground-Water Quality Monitoring and Assessment Program for California.
https://pubs.usgs.gov/wri/wri034166/pdf/wri034166.pdf
5. World Bank. Practical Manual on Groundwater Quality Monitoring.
https://openknowledge.worldbank.org/entities/publication/f4c46d08-0b6f-5c74-a44b-bb545e6c2dc6
6. Geological Service of Europe (GSEU). Methodology and Protocol for Assessing Groundwater Quality.
https://www.geologicalservice.eu/upload/content/2028/gseu-d4-8_methodology-and-protocol-for-assessing-groundwater-quality-v1.pdf
7. ASTM International. D5092 - Standard Practice for Design and Installation of Ground Water Monitoring Wells.
8. ISO. ISO 5667-11: Water quality — Sampling — Guidance on sampling of groundwaters.
9. US EPA. Low Stress (Low Flow) Purging and Sampling Procedure for the Collection of Groundwater Samples.
10. Interstate Technology Regulatory Council (ITRC). Technical and Regulatory Guidance for Sampling of Groundwater.

Expert Groundwater Quality Monitoring and Environmental Monitoring Well Consulting Services
SUPRA International provides comprehensive groundwater monitoring services including network design, well installation specifications, sampling protocol development, quality assurance program establishment, data interpretation and statistical analysis, regulatory compliance support, and long-term monitoring program management. Our hydrogeologists and environmental specialists support industrial facilities, municipalities, regulatory agencies, and property owners implementing scientifically defensible monitoring programs meeting international best practices and local regulatory requirements.
Need expert support for groundwater quality monitoring program design and implementation?
Contact us to discuss your groundwater monitoring objectives and technical requirements
Share:
If you face challenges in water, waste, or energy, whether it is system reliability, regulatory compliance, efficiency, or cost control, SUPRA is here to support you. When you connect with us, our experts will have a detailed discussion to understand your specific needs and determine which phase of the full-lifecycle delivery model fits your project best.