The Growing Risk to Energy Infrastructure from Extreme Natural Events: Energy System Resilience in Natural Disasters
Energy System Resilience in Natural Disasters: Framework for Crisis Management, Rapid Recovery, and Long-Term Infrastructure Protection
Reading Time: 76 minutes
Key Highlights
• Global Energy Vulnerability: Natural disasters cause 849-1,051 power outages annually in developed countries with average durations of 1,133-3,597 minutes, while developing nations experience compounded impacts where storm-induced outages overlap with chronic infrastructure deficiencies affecting billions of people dependent on electricity for essential services
• Infrastructure Hardening Economics: World Bank analysis demonstrates that targeted resilience investments increase power sector capital costs by only 3-6% (USD 9-27 billion annually) when focusing on exposed assets, reducing damage risk by factor of 2-3, while comprehensive hardening of all assets requires 30% cost premium (USD 96-296 billion) creating strategic prioritization imperatives
• Renewable Energy Solutions: Distributed generation through solar microgrids with battery storage provides 24-72 hour emergency power at USD 3,000-8,000 per kW installed capacity, enabling critical facilities (hospitals, water treatment, communications) to maintain operations during grid outages with 15-25 year equipment lifespans and declining costs
• Recovery Framework Implementation: Post-disaster energy restoration follows phased approach prioritizing critical infrastructure (0-72 hours), essential services (3-14 days), and full system recovery (2-12 months), with pre-positioned equipment, trained rapid response teams, and mutual assistance agreements reducing restoration time by 40-60% compared to ad-hoc approaches
Executive Summary
Natural disasters pose existential threats to energy infrastructure worldwide, with cascading consequences affecting public health, economic productivity, emergency response capability, and social stability. Power sector assets face heterogeneous vulnerabilities across generation facilities, transmission networks, distribution systems, and fuel supply chains, each exhibiting distinct failure modes when subjected to earthquakes, floods, hurricanes, tsunamis, and other extreme events. Global evidence indicates storms represent primary cause of electricity disruptions in developed countries accounting for 849-1,051 annual outages in United States and 235 outages in Europe over 2000-2017 period, with average durations ranging from 1,133 minutes in Europe to 3,597 minutes for natural shock events in United States, while developing nations experience compounded vulnerabilities where natural disasters exacerbate chronic infrastructure deficiencies affecting populations already experiencing daily service interruptions.
Indonesia's geographic position within Pacific Ring of Fire and exposure to monsoon patterns creates acute disaster vulnerability affecting energy systems across archipelago, with recent events including 2004 Aceh tsunami destroying coastal power infrastructure, 2018 Palu earthquake and tsunami causing widespread outages in Central Sulawesi, and recurring seasonal flooding in Kalimantan and Sumatra disrupting generation and transmission facilities. These disasters demonstrate interconnected nature of energy system vulnerabilities where physical asset damage, fuel supply disruption, telecommunications failures, and workforce displacement combine creating complex recovery challenges requiring integrated solutions addressing immediate crisis response, intermediate service restoration, and long-term resilience enhancement through infrastructure hardening, distributed generation deployment, and institutional capacity building.
This comprehensive technical guide examines energy crisis management following natural disasters through analysis of vulnerability patterns, preparedness strategies, emergency response protocols, recovery frameworks, and resilience investment approaches. Drawing on authoritative sources including World Bank power sector resilience assessments, APEC energy resiliency guidelines, International Renewable Energy Agency infrastructure protection frameworks, U.S. Department of Energy emergency planning guides, and Indonesian case studies from Universitas Andalas and disaster management agencies, content provides actionable guidance for government officials, utility operators, emergency managers, infrastructure planners, and development organizations working to strengthen energy system resilience against natural hazards. Coverage encompasses pre-disaster vulnerability assessment and hardening measures, emergency preparedness planning and resource positioning, rapid response deployment and damage assessment, phased restoration prioritizing critical loads, renewable energy and microgrid solutions providing islanding capability, economic analysis of resilience investments demonstrating cost-effectiveness, regulatory frameworks enabling coordinated action, and technology innovations including smart grids, energy storage, and advanced materials enhancing system robustness.
Economic analysis demonstrates targeted resilience investments prove cost-effective when properly designed, with World Bank studies indicating that hardening only exposed power assets against natural hazards requires USD 9-27 billion annual investment representing 3-6% increase over baseline capital expenditure while reducing damage risk by factor of 2-3 for new infrastructure. Alternative scenario hardening all new assets against wind, floods, and earthquakes regardless of exposure location requires USD 96-296 billion annually representing 30% cost increase, highlighting importance of spatial hazard mapping and risk-based prioritization ensuring scarce resources achieve maximum impact. Benefits extend beyond avoided physical damage to include reduced service interruptions preventing economic losses estimated at 1-5% of GDP annually in disaster-prone regions, improved public health outcomes maintaining critical services during emergencies, and enhanced investor confidence supporting economic development in vulnerable areas requiring reliable electricity supply.
Natural Disaster Impacts on Energy Infrastructure: Vulnerability Analysis and Failure Mechanisms
Energy infrastructure exhibits diverse vulnerability profiles across different asset types and natural hazard categories, requiring comprehensive understanding of failure mechanisms enabling targeted protection strategies. Generation facilities face specific risks including coastal flooding threatening thermal plants and refineries located near water bodies for cooling purposes, earthquake structural damage affecting turbine-generator sets and control systems, high winds damaging wind turbines and solar panel arrays, ash fall from volcanic eruptions clogging air intakes and coating equipment, and fuel supply disruptions when natural disasters damage pipelines, storage terminals, or transportation networks. Transmission systems prove particularly vulnerable to wide-area hazards with overhead lines susceptible to wind damage from hurricanes causing tower collapses and conductor breakage, flooding undermining foundation structures, ice storms coating conductors exceeding design limits, wildfires igniting from arcing faults or caused by line contact with vegetation, and landslides destroying tower foundations in mountainous terrain.
Primary Natural Hazards Affecting Energy Systems:
| Hazard Type | Primary Impacts | Vulnerable Assets | Typical Duration |
|---|---|---|---|
| Hurricanes/Typhoons | Wind damage to overhead lines, flooding of substations, fuel supply disruption, debris impact | Transmission towers, distribution poles, coastal generation, above-ground equipment | 3-30 days |
| Earthquakes | Structural damage to generation, substation equipment failure, underground cable rupture, liquefaction | Power plants, substations, underground systems, rigid structures | 1-14 days |
| Floods | Equipment submersion, foundation erosion, electrical short circuits, contamination | Low-lying plants, substations, underground systems, control buildings | 2-21 days |
| Tsunamis | Catastrophic flooding, debris impact, saltwater contamination, total facility destruction | Coastal generation, transmission substations, distribution systems in inundation zones | 30-180 days |
| Wildfires | Tower/pole destruction, line ignition, smoke damage to equipment, access restriction | Transmission lines through forests, distribution in interface zones, substations | 1-7 days |
| Ice Storms | Conductor icing exceeding design limits, tower collapse, tree falls onto lines | Overhead transmission/distribution, structures in ice-prone regions | 3-14 days |
| Volcanic Eruptions | Ash coating equipment, air intake clogging, acid rain corrosion, lahars destroying infrastructure | Thermal plants, substations, transmission insulators, cooling systems | 7-90 days |
| Landslides | Tower foundation failure, buried infrastructure, access road destruction | Transmission in mountainous terrain, hydropower facilities, access infrastructure | 5-30 days |
Cascading Failure Mechanisms:
• Primary failures: Direct physical damage to generation, transmission, or distribution assets
• Secondary failures: Fuel supply disruption, cooling water unavailability, telecommunications loss
• Tertiary failures: Workforce displacement, supply chain disruption, coordination breakdown
• System-level impacts: Islanding, voltage collapse, frequency instability, blackout propagation
• Cross-sector dependencies: Water pumping, telecommunications, fuel distribution, emergency services
Regional Vulnerability Patterns (Indonesia Context):
• Sumatra: Earthquake risk (Sunda megathrust), volcanic activity (Sinabung, Merapi), seasonal flooding
• Java: Volcanic hazards (Merapi, Kelud, Semeru), earthquake exposure, urban concentration risk
• Kalimantan: Extensive seasonal flooding, peat fires, river-dependent access for equipment
• Sulawesi: High seismic risk (Palu-Koro fault), tsunami exposure, complex terrain limiting redundancy
• Eastern Indonesia: Remote locations, limited grid interconnection, dependence on diesel generation
• Coastal areas nationwide: Sea level rise, coastal flooding, tsunami exposure, saltwater intrusion
Distribution systems face localized but widespread impacts during natural disasters including pole damage from high winds affecting thousands of individual structures, underground cable flooding in low-lying areas, transformer failures from water intrusion or overloading during restoration, vegetation contact during storms requiring extensive line clearing, and access challenges when roads become impassable preventing repair crews from reaching damage sites. These distribution impacts typically affect largest number of customers despite lower per-unit asset values, with restoration requiring labor-intensive work inspecting and repairing individual components across vast service territories. Compound disasters where multiple hazards occur simultaneously or in rapid succession create particularly severe challenges, such as hurricanes combining wind, storm surge, and inland flooding, or earthquakes triggering tsunamis and liquefaction, overwhelming response capacity and extending recovery timelines.
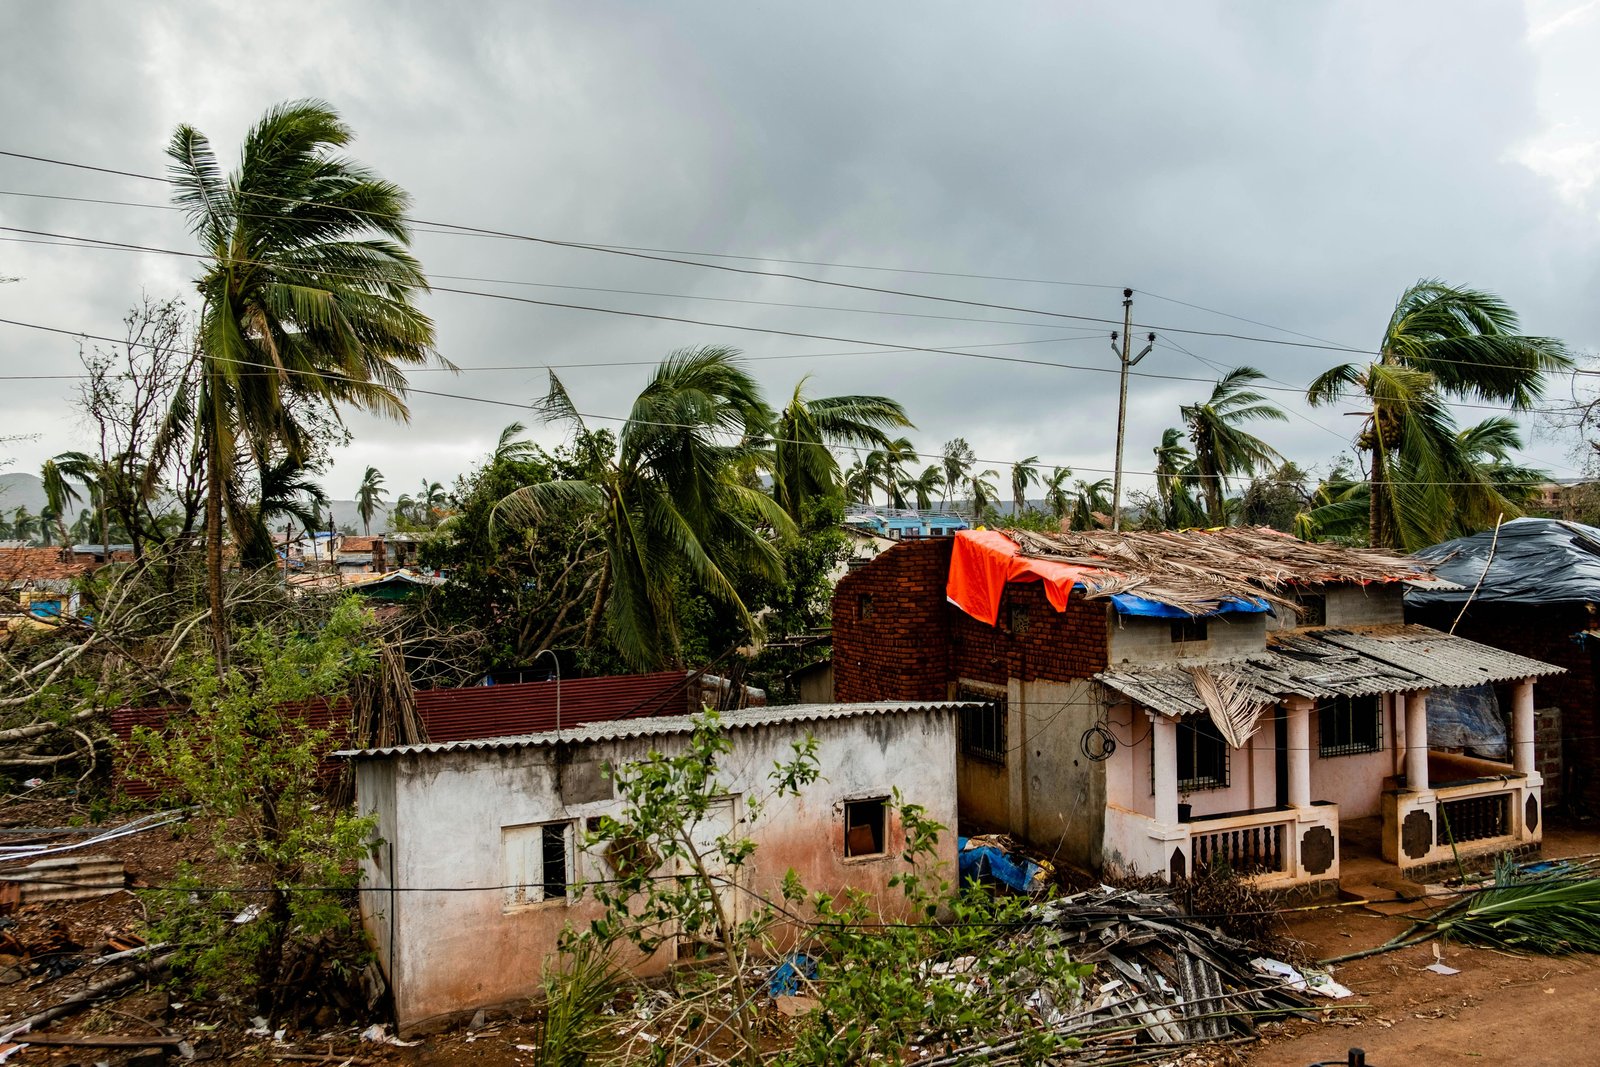
Case Study: Indonesia Flash Flood Energy Crisis - Pesisir Selatan District
Event Background:
Flash flooding in Pesisir Selatan district, West Sumatra, caused total power outages affecting approximately 50,000 residents across multiple sub-districts. The disaster destroyed critical energy infrastructure including substations, distribution lines, and local generation facilities, while simultaneously cutting road access preventing conventional repair equipment deployment. Floodwaters reached 2-3 meters depth in populated areas, submerging ground-level electrical equipment and creating immediate public safety hazards from live wires and energized equipment in standing water.
Infrastructure Damage Assessment:
• Substations: 3 distribution substations completely flooded requiring full equipment replacement
• Distribution network: 15 km overhead lines damaged, 50+ poles collapsed or tilted
• Transformers: 80 distribution transformers submerged requiring oil analysis and potential replacement
• Customer connections: 5,000+ service drops damaged requiring individual inspection and repair
• Access infrastructure: Multiple bridges washed out, roads impassable for standard utility vehicles
Emergency Response and Recovery:
Universitas Andalas engineering team collaborated with local government and PLN (state electricity company) deploying emergency power solutions including portable generators for critical facilities (hospitals, water treatment, communications), temporary overhead lines using available materials, and systematic damage assessment prioritizing restoration sequence. Community engagement proved essential with local residents assisting debris clearing and providing accommodation for repair crews when hotels remained inaccessible. Response demonstrated importance of pre-positioned emergency equipment, trained local response capability, and community preparedness enabling faster recovery compared to awaiting centralized assistance from provincial or national level.
Lessons Learned and Resilience Improvements:
• Elevation requirements: Substations rebuilt with critical equipment elevated 4 meters above historical flood levels
• Distributed generation: Solar-battery systems installed at critical facilities providing islanding capability
• Equipment pre-positioning: Mobile generators and repair materials staged at strategic locations throughout district
• Community training: Local electricians trained on emergency response protocols and temporary power installation
• Early warning integration: Flood monitoring systems linked to automatic load shedding protecting equipment
• Hardened communications: Satellite phones and radio systems independent of cellular networks for coordination
Pre-Disaster Preparedness: Risk Assessment, Infrastructure Hardening, and Emergency Planning
Effective disaster resilience begins with comprehensive preparedness activities undertaken before natural hazards strike, encompassing vulnerability assessment identifying highest-risk assets and failure modes, infrastructure hardening implementing physical protection measures, emergency planning establishing response protocols and resource requirements, equipment and material pre-positioning enabling rapid deployment, workforce training ensuring personnel capability during crisis conditions, and stakeholder coordination creating integrated response across government agencies, utilities, and private sector organizations. Risk assessment employs spatial analysis overlaying energy infrastructure locations with natural hazard maps identifying exposure to floods, earthquakes, wind zones, and other threats, combined with consequence analysis evaluating criticality of each asset based on customers served, redundancy availability, and system stability impacts.
Infrastructure Hardening Strategies and Cost-Effectiveness
Transmission System Hardening:
| Measure | Application | Cost Premium | Resilience Benefit |
|---|---|---|---|
| Lattice tower strengthening | High wind zones, seismic areas | 10-15% | 50% reduction in wind-related failures |
| Composite insulators | Coastal areas, volcanic regions | 5-8% | 70% reduction in contamination flashovers |
| Underground cables | High-density urban, extreme weather | 300-500% | 90% reduction in storm-related outages |
| Seismic isolators | Substations in earthquake zones | 8-12% | 80% reduction in earthquake damage |
| Flood barriers/elevation | Flood-prone substations | 3-7% | Complete protection to design flood level |
Generation Facility Protection:
• Seismic strengthening: Base isolation, flexible pipe connections, equipment anchorage (8-15% cost increase)
• Flood protection: Elevated equipment platforms, flood walls, submersible pumps (5-10% increase)
• Wind resistance: Reinforced structures, aerodynamic design, debris shields (6-12% increase)
• Fuel supply redundancy: Multiple suppliers, on-site storage expansion, alternative fuel capability
• Cooling system backup: Air-cooled condensers, cooling tower redundancy, emergency water sources
Distribution System Resilience:
• Vegetation management: Aggressive tree trimming programs reducing contact faults by 60-80%
• Animal guards: Insulator covers preventing wildlife-caused outages (small cost, high impact)
• Fuse coordination: Optimized protection settings minimizing outage extent during faults
• Automated sectionalizing: Remote-controlled switches isolating damaged sections, reducing customers affected
• Pole inspection programs: Systematic structural assessment replacing weak poles before failures
Cost-Benefit Analysis Framework:
World Bank methodology evaluates resilience investments comparing upfront hardening costs against expected damage reduction and service interruption costs over asset lifetime. Key parameters include:
• Hazard probability: Annual likelihood of design event occurrence (e.g., 1% for 100-year flood)
• Asset exposure: Value of infrastructure located in hazard zone requiring protection
• Failure probability: Likelihood of asset failure given hazard occurrence (50-90% for unprotected assets)
• Damage costs: Repair/replacement expenses plus service interruption economic impacts
• Protection effectiveness: Percentage reduction in failure probability from hardening measures
• Discount rate: Typically 3-7% for public infrastructure economic analysis
Example: Substation flood protection costing USD 500,000 (7% of asset value) in 2% annual flood zone prevents USD 5 million damage, pays back in 2-3 expected events over 30-year asset life, NPV positive at 5% discount rate.
Emergency planning establishes organizational structures, communication protocols, resource allocation procedures, and decision-making frameworks enabling effective response when disasters occur. Plans should identify critical facilities requiring priority restoration including hospitals, water treatment plants, telecommunications centers, emergency services, and critical industrial loads; establish mutual assistance agreements with neighboring utilities providing workforce and equipment during large-scale events; develop equipment and material stockpiles including poles, transformers, conductors, and generators positioned for rapid deployment; create damage assessment teams with pre-assigned responsibilities and equipment; and conduct regular exercises testing plan effectiveness identifying gaps requiring correction. Communications prove essential during disasters requiring redundant systems including satellite phones, mobile radio networks independent of commercial telecommunications, and emergency operations centers with backup power ensuring continuity.
Emergency Response Protocols: Rapid Assessment, Damage Evaluation, and Immediate Stabilization
Immediate post-disaster period requires swift action assessing damage extent, ensuring personnel safety, preventing secondary hazards, and deploying emergency power to critical facilities while broader system restoration plans develop. Initial response within first 24-48 hours focuses on situation awareness gathering information from field reports, aerial surveys, and automated monitoring systems to understand failure extent and access conditions; safety measures de-energizing damaged infrastructure preventing electrocution hazards, securing facilities against unauthorized access, and establishing safety perimeters around hazardous equipment; emergency power deployment providing temporary generation to hospitals, emergency shelters, water treatment facilities, and communication centers using mobile generators and rapid connection equipment; and resource mobilization activating mutual assistance agreements, deploying pre-positioned equipment and materials, and establishing logistics infrastructure supporting sustained operations.
Rapid Damage Assessment Methodology
Phase 1: Aerial Reconnaissance (0-12 hours)
• Helicopter surveys: Transmission line inspection identifying tower failures, conductor damage, right-of-way blockages
• Drone deployment: Detailed substation inspection, structure damage assessment, access route evaluation
• Satellite imagery: Wide-area impact assessment, flooding extent, before/after comparison analysis
• SCADA data review: Circuit breaker status, voltage/frequency deviations, automatic protection operations
• Customer reports: Outage extent mapping, hazardous condition identification, access information
Phase 2: Ground Inspection (12-72 hours)
• Substation walk-through: Equipment damage cataloging, foundation integrity checks, control system functionality
• Transmission patrol: Systematic line inspection documenting damage locations, GPS coordinates, repair requirements
• Distribution survey: Pole-by-pole assessment identifying failed structures, downed conductors, damaged transformers
• Generation facilities: Structural integrity evaluation, equipment operability testing, fuel system inspection
• Access evaluation: Road conditions, bridge status, helicopter landing zones, heavy equipment routing
Phase 3: Detailed Engineering Assessment (2-7 days)
• Structural analysis: Foundation stability evaluation, building damage assessment, repair vs. replace decisions
• Electrical testing: Transformer oil analysis, cable insulation testing, relay calibration verification
• Material quantification: Detailed bill of materials for repairs, procurement lead times, substitution options
• Labor estimation: Crew requirements by skill category, duration estimates, resource allocation optimization
• Restoration sequencing: Critical path analysis, parallel work opportunities, logistics constraints
Assessment Documentation and Communication:
Standardized forms capturing:
• Asset identification (facility name, equipment ID, voltage level, GPS location)
• Damage classification (failed, damaged but repairable, functional but compromised, undamaged)
• Repair requirements (materials, labor hours, equipment needs, access requirements)
• Priority ranking (critical infrastructure, high customer impact, system stability, economic importance)
• Photos and videos documenting conditions for insurance, regulatory reporting, lessons learned
• Safety hazards identified requiring immediate attention or warning signage
Information consolidated in geographic information system (GIS) platform enabling visualization, resource allocation, and progress tracking throughout restoration process.
Emergency power solutions deployed during initial response phase serve critical loads while main system restoration progresses, utilizing portable generators ranging from 5 kW trailer-mounted units for small facilities to 2 MW trailer-mounted substations providing temporary substation capacity, mobile transformers and switchgear creating temporary electrical infrastructure, emergency fuel supply chains maintaining generator operations potentially over weeks, and rapid connection systems including specialized cables, connectors, and switching equipment enabling safe energization without permanent modifications. Solar-battery microgrids increasingly supplement traditional diesel generation providing fuel-independent emergency power with several hours to days of storage capacity, particularly valuable when fuel supply chains face disruption or access constraints prevent regular refueling operations.
Distributed Generation and Microgrids: Renewable Energy Solutions for Disaster Resilience
Distributed generation resources including solar photovoltaics, small wind turbines, micro-hydropower, and biogas systems combined with battery energy storage create microgrids capable of operating independently during grid outages, providing critical resilience during natural disasters when centralized infrastructure fails. These systems prove particularly valuable for critical facilities requiring continuous power including hospitals maintaining life-support equipment and refrigerated medications, water treatment plants providing safe drinking water essential for public health, telecommunications facilities enabling emergency coordination and public information, emergency shelters housing displaced populations, and critical industrial loads where production interruption creates severe economic or safety consequences.
Microgrid Design for Disaster Resilience
System Components and Sizing:
| Component | Typical Capacity | Cost (USD/kW) | Function/Benefit |
|---|---|---|---|
| Solar PV array | 50-500 kW | 800-1,200 | Primary generation, fuel-free operation, 25-year life |
| Battery storage (lithium-ion) | 100-1,000 kWh | 400-700/kWh | Energy storage, grid outage bridging, 10-15 year life |
| Backup generator (diesel/gas) | 50-250 kW | 300-600 | Extended outage support, capacity reserve, fuel required |
| Inverter/controller system | Per generation | 200-400 | Power conditioning, islanding control, grid integration |
| Distribution/protection | Site-specific | 150-300 | Load circuits, protection devices, monitoring systems |
Example Hospital Microgrid (250 kW critical load):
Generation capacity: 300 kW solar PV + 200 kW diesel backup
Storage capacity: 600 kWh lithium-ion (2.4 hours full load, 12 hours reduced load)
Control system: Automatic islanding upon grid loss, load prioritization, generator dispatch
Capital cost: USD 1,800,000 total (USD 7,200/kW average including all components)
Operating cost: USD 40,000/year (maintenance, battery replacement reserve, minimal fuel)
Grid-connected operation: Reduces utility bills USD 80,000/year through solar generation
Resilience value: Maintains operations during 3-5 day grid outages typical of major disasters
Payback period: 15 years on utility savings alone, 8 years including resilience value
Islanding Operation During Grid Outages:
When grid fails, microgrid controller automatically:
1. Detects outage: Monitors grid voltage/frequency, identifies loss within 100-500 milliseconds
2. Disconnects from grid: Opens isolation switch preventing back-feed and enabling independent operation
3. Establishes island: Battery inverters form stable voltage/frequency for local loads
4. Starts generation: Solar continues if available, generator starts if battery depleted or high load
5. Manages loads: Non-critical loads shed if generation insufficient, priority to life-safety systems
6. Monitors grid: Continuously checks for grid restoration, resynchronizes and reconnects when stable
Seamless transition (<2 second interruption) protects sensitive equipment, maintains critical operations.
Indonesian Applications and Case Studies:
• Puskesmas (health clinics): 20-50 kW systems maintaining refrigeration, lighting, medical equipment
• Water treatment: 100-300 kW supporting pumps, treatment processes, distribution systems
• Telecommunications towers: 5-15 kW solar-battery replacing diesel generators, reducing fuel dependence
• Emergency shelters: Portable 10-30 kW systems rapidly deployed to temporary housing areas
• Remote communities: Permanent microgrids replacing diesel mini-grids in un-electrified islands
National energy policy (Perpres 112/2022) mandates renewable energy integration supporting microgrid deployment, while ESDM regulations establish technical standards for grid interconnection and islanding operation ensuring safety and reliability.
Phased Restoration Framework: Prioritization, Resource Allocation, and Service Recovery
Systematic restoration following natural disasters employs phased approach prioritizing critical infrastructure and efficiently allocating scarce resources maximizing societal benefit while working toward complete system recovery. Framework typically progresses through emergency phase (0-72 hours) focusing on life-safety, critical facilities, and damage stabilization; restoration phase (3-30 days) systematically rebuilding infrastructure serving progressively larger customer populations; and reconstruction phase (1-12 months) implementing permanent repairs, incorporating resilience enhancements, and conducting lessons-learned reviews informing future preparedness. Each phase requires distinct resource allocation, organizational structures, and success metrics appropriate to objectives and constraints.
Restoration Prioritization Matrix
Priority Level 1 - Critical Infrastructure (0-24 hours target):
• Hospitals and emergency medical facilities maintaining life-support, surgery capability, trauma care
• Emergency services including police, fire, ambulance, disaster response coordination centers
• Water treatment and pumping stations providing safe drinking water for affected populations
• Telecommunications facilities enabling emergency communications and public information
• Emergency shelters housing displaced populations requiring power for lighting, HVAC, food preparation
• Critical government facilities coordinating response including emergency operations centers
• Fuel distribution infrastructure supporting emergency vehicle operations and generator refueling
Priority Level 2 - Essential Services (24-72 hours target):
• Additional healthcare facilities including clinics, dialysis centers, nursing homes
• Wastewater treatment preventing environmental contamination and disease outbreaks
• Food storage and distribution (cold storage, grocery stores, food banks)
• Banking and financial services enabling economic activity resumption
• Fuel stations supporting transportation and generator operations
• Schools serving as shelters or community centers
• Critical industrial loads where shutdown creates safety hazards or severe economic impact
Priority Level 3 - High-Density Residential (3-7 days target):
• Apartment buildings and multi-family housing serving large populations per connection
• Commercial districts supporting economic recovery and employment
• Transportation infrastructure including traffic signals, street lighting for safety
• Government offices resuming normal operations
• Manufacturing facilities restarting production, preventing permanent job losses
• Educational institutions resuming classes
Priority Level 4 - General Service Restoration (7-30 days target):
• Remaining residential customers restored systematically by circuit
• Non-critical commercial and industrial loads
• Rural and remote areas requiring extensive reconstruction
• Individual service drops and customer-owned equipment
Factors modifying priorities:
• Ease of restoration (customers per repair hour favoring high-impact repairs)
• Access availability (repairing accessible infrastructure while awaiting access to difficult locations)
• Material availability (using available materials while awaiting specialized equipment)
• Public safety (eliminating hazards taking precedence regardless of customer count)
• Political considerations (visible progress maintaining public confidence, preventing civil unrest)
Resource allocation during restoration requires sophisticated logistics coordinating crews, materials, equipment, and support services across potentially vast service territories with damaged infrastructure and limited communications. Mutual assistance programs formalized through industry associations enable utilities to request and receive hundreds or thousands of additional workers from unaffected regions, with standardized protocols for requesting assistance, qualifying and integrating external crews, providing necessary support including lodging and meals, and cost recovery through predetermined rates or actual expense reimbursement. Material logistics involves establishing forward operating bases near affected areas stocking common repair items, coordinating procurement of specialized equipment requiring long lead times, and managing transportation when road networks remain compromised requiring alternative routes, helicopter delivery, or maritime transport.
Economic Analysis of Resilience Investments: Cost-Benefit Framework and Financing Mechanisms
Evaluating resilience investments requires comprehensive economic analysis weighing upfront hardening costs against expected benefits including avoided damage, reduced service interruptions, improved public health outcomes, and enhanced economic productivity. World Bank methodology establishes framework comparing costs of infrastructure strengthening against probabilistic risk reduction over asset lifespans, finding that targeted investments in highest-risk assets achieve cost-effectiveness while comprehensive hardening approaches face affordability challenges requiring prioritization and phased implementation. Analysis incorporates capital costs for protective measures, recurring operations and maintenance expenses, expected damage frequencies and severities under different scenarios, service interruption economic impacts, and non-market benefits including public health, safety, and environmental protection.
Cost-Benefit Analysis Example: Transmission System Hardening
Baseline Conditions (500 km transmission corridor, 150 kV):
Asset value: USD 300 million (USD 600,000/km for towers, conductors, right-of-way)
Exposure: 100 km (20%) passes through high-wind zone with 2% annual hurricane probability
Vulnerability: 30% probability of major damage given hurricane direct strike
Expected annual damage: USD 300M × 20% × 2% × 30% = USD 360,000/year
Service interruption: Average 10-day outage affecting 500 MW load
Economic impact: 500 MW × 24 hr/day × 10 days × USD 100/MWh = USD 12 million per event
Expected annual interruption cost: USD 12M × 2% × 30% = USD 72,000/year
Total expected annual loss: USD 432,000/year (damage + interruption)
Hardening Investment Option:
Strengthen 100 km exposed section with reinforced towers, composite insulators
Cost premium: 12% above baseline = USD 60M × 20% × 12% = USD 7.2 million
Effectiveness: Reduces failure probability from 30% to 8% (73% reduction)
New expected annual loss: USD 432,000 × (8%/30%) = USD 115,000/year
Annual benefit: USD 432,000 - USD 115,000 = USD 317,000/year avoided losses
Economic Evaluation (30-year analysis, 5% discount rate):
Present value of benefits: USD 317,000/year × 15.37 annuity factor = USD 4.87 million
Present value of costs: USD 7.2 million upfront investment
Net present value: USD 4.87M - USD 7.2M = -USD 2.33 million (negative)
Benefit-cost ratio: 4.87 / 7.2 = 0.68 (less than 1.0, not cost-justified)
Sensitivity Analysis:
If hurricane probability increases to 3% annually (climate change scenario):
Annual benefit: USD 475,000/year, PV = USD 7.3M, NPV = +USD 0.1M (marginally positive)
If interruption cost increases to USD 150/MWh (higher economic value):
Annual benefit: USD 440,000/year, PV = USD 6.76M, NPV = -USD 0.44M (still negative)
If both factors change together:
Annual benefit: USD 633,000/year, PV = USD 9.73M, NPV = +USD 2.53M (strongly positive)
Policy Implications:
Analysis demonstrates resilience economics sensitive to hazard probability, interruption valuation, and effectiveness assumptions. Investments appear uneconomic under baseline conditions but become justified under plausible climate change or economic value scenarios. Public sector decision-making may proceed with negative NPV projects considering:
• Non-market benefits (public safety, health, environmental) not fully captured in economic analysis
• Risk aversion preferring certain upfront costs over uncertain future losses
• Distribution concerns protecting vulnerable populations despite unfavorable aggregate economics
• Irreversibility of climate change requiring anticipatory adaptation investments
• Learning-by-doing benefits informing future investment decisions through pilot programs
Alternative approaches include phased hardening as assets reach end-of-life (lower incremental cost), targeted protection of highest-criticality segments (hospitals, emergency services), or portfolio diversification hardening some assets while accepting risk on others.
Financing mechanisms enabling resilience investments span traditional utility rate recovery incorporating hardening costs into electricity tariffs, government grants or subsidies particularly for public health and safety benefits extending beyond utility revenue base, development bank lending through World Bank, Asian Development Bank, or bilateral agencies offering concessional terms for climate adaptation, climate finance through Green Climate Fund or Adaptation Fund supporting developing country investments, insurance premium reductions rewarding risk reduction enabling lower annual costs offsetting upfront investments, and public-private partnerships sharing risks and returns between government and private investors. Indonesian context requires careful consideration of tariff affordability constraints, limited government fiscal capacity, and regulatory frameworks enabling cost recovery while protecting vulnerable populations through targeted subsidies or lifeline rates.
Regulatory Framework and Institutional Coordination for Energy Resilience
Effective disaster resilience requires supportive regulatory frameworks and institutional arrangements enabling coordinated action across government agencies, utilities, private sector, and communities. Regulatory measures include design standards establishing minimum resilience requirements for new infrastructure, operating protocols specifying vegetation management, inspection frequencies, and preventive maintenance activities, emergency planning mandates requiring utilities develop and exercise response plans, mutual assistance frameworks enabling cross-utility cooperation during major events, cost recovery mechanisms allowing prudent resilience investments into rates, and performance incentives rewarding utilities achieving resilience metrics or penalizing avoidable failures. Indonesian energy sector operates under framework established by Ministry of Energy and Mineral Resources (ESDM) with implementation through PLN (state electricity company) and regulatory oversight from ESDM and provincial governments.
Key Regulatory and Institutional Elements
Indonesian Energy Sector Resilience Framework:
• Perpres 112/2022: Presidential Regulation on renewable energy acceleration including disaster resilience
• Permen ESDM 50/2017: Minister of Energy Regulation on renewable energy utilization for electricity
• SNI standards: Indonesian National Standards for electrical infrastructure design and construction
• RUPTL (Electricity Supply Business Plan): 10-year planning incorporating resilience considerations
• PLN operational standards: Utility-specific design criteria, operating procedures, emergency protocols
• BNPB coordination: National Disaster Management Agency coordinating cross-sectoral response
• Local government role: Provincial and district coordination, land use planning, shelter management
International Best Practice Frameworks:
• APEC Energy Resiliency Guidelines: Comprehensive framework covering preparedness through recovery
• OSCE Natural Hazards Protection: European standards for electricity network protection
• U.S. NIST Community Resilience Planning: Systematic approach to infrastructure resilience
• IEA Energy Security Framework: International Energy Agency principles for supply reliability
• IRENA Grid Resilience: Renewable energy integration for disaster-resilient power systems
• ISO 31000 Risk Management: Systematic risk assessment and treatment framework
Institutional Coordination Mechanisms:
• Emergency Operations Center: Central coordination facility activated during disasters
• Incident Command System: Standardized organizational structure for emergency management
• Unified Command: Joint authority when multiple agencies share jurisdiction
• Mutual aid agreements: Pre-arranged assistance between utilities, formalized through MOUs
• Public-private coordination: Regular meetings, exercises, information sharing protocols
• International assistance: Procedures for requesting/accepting foreign aid during major disasters
Performance Metrics and Accountability:
• SAIDI (System Average Interruption Duration Index): Total customer-minutes of interruption
• SAIFI (System Average Interruption Frequency Index): Average outage frequency per customer
• CAIDI (Customer Average Interruption Duration Index): Average outage duration when occurs
• Resilience metrics: Time to restore X% of customers after major events
• Preparedness indicators: Drill participation, plan currency, equipment inventory adequacy
• Financial metrics: Hardening investment levels, insurance coverage, emergency fund adequacy
Regulatory reporting requirements establish transparency enabling public oversight, performance comparison across utilities, and continuous improvement through benchmarking against national or international standards.
Technology Innovation and Future Trends in Energy Resilience
Emerging technologies create new opportunities enhancing energy system resilience through improved monitoring, faster response, autonomous operation, and adaptation to changing conditions. Advanced monitoring systems deploying extensive sensor networks throughout infrastructure enable real-time condition assessment, early fault detection, and proactive maintenance preventing failures before they occur during stress conditions. Smart grid technologies including automated switching, distributed intelligence, and self-healing capabilities reduce outage extent and duration by automatically isolating faults and reconfiguring networks restoring service without manual intervention. Energy storage systems provide multiple resilience benefits including frequency regulation during disturbances, backup power during outages, and load shifting reducing peak demand stress on vulnerable infrastructure.
Innovative Technologies Enhancing Resilience:
Advanced Monitoring and Sensing:
• Phasor Measurement Units (PMUs): Real-time grid stability monitoring detecting oscillations, voltage collapse
• Optical fiber sensors: Continuous temperature, strain monitoring along cables and structures
• Drone inspection systems: Rapid post-disaster damage assessment, routine condition monitoring
• Satellite remote sensing: Wide-area monitoring of vegetation, flooding, infrastructure condition
• IoT sensor networks: Distributed monitoring of transformers, switches, environmental conditions
• Predictive analytics: Machine learning identifying failure patterns enabling preventive maintenance
Smart Grid and Automation:
• Distribution automation: Automatic fault isolation and service restoration reducing outage duration
• Advanced metering infrastructure (AMI): Real-time outage detection, remote service connection/disconnection
• Microprocessor relays: Adaptive protection settings responding to system conditions
• SCADA/EMS integration: Centralized monitoring and control of distributed resources
• Demand response systems: Automated load reduction during emergencies extending available capacity
• Blockchain energy trading: Peer-to-peer transactions enabling community microgrids
Energy Storage Technologies:
• Lithium-ion batteries: 2-4 hour duration, declining costs (USD 150-300/kWh), modular scaling
• Flow batteries: 4-10 hour duration, independent power/energy sizing, 20+ year life
• Flywheels: Seconds to minutes duration, high power density, frequency regulation
• Compressed air storage: Multi-hour duration, large capacity potential, geographic constraints
• Hydrogen systems: Seasonal storage potential, fuel cell generation, emerging technology
• Vehicle-to-grid (V2G): Electric vehicles providing distributed storage and backup power
Advanced Materials and Design:
• Composite insulators: Superior performance in contaminated environments, lighter weight, lower maintenance
• ACCC conductors: Aluminum conductor composite core enabling higher current, lower sag
• Fiber optic cables: Integrated sensing capability, lighter weight, non-conductive safety
• Resilient transformers: Sealed designs preventing contamination, enhanced seismic resistance
• Modular substations: Factory-built, rapid deployment, standardized designs
• Self-healing materials: Automatic repair of minor damage, extended life under stress
Future trends include increasing electrification creating critical dependency requiring enhanced resilience, climate change intensifying natural hazards necessitating adaptive infrastructure, distributed resources enabling community resilience but requiring coordination, and artificial intelligence optimizing complex tradeoffs across reliability, cost, and sustainability objectives.
Global Case Studies: Lessons from Major Disaster Response and Recovery
Examining major natural disasters and subsequent energy system responses provides valuable lessons applicable across diverse contexts and hazard types. Hurricane Maria (Puerto Rico, 2017) destroyed entire island's electrical grid affecting 3.4 million people for months, demonstrating catastrophic failure when infrastructure lacks adequate hardening, backup capacity, or distributed generation, while recovery highlighted importance of pre-positioned materials, mutual assistance agreements, and permanent resilience improvements including microgrid deployment and transmission undergrounding. Great East Japan Earthquake and Tsunami (2011) caused widespread power outages and Fukushima nuclear disaster, revealing nuclear generation vulnerabilities while demonstrating effective emergency planning, rapid damage assessment, and systematic restoration procedures bringing most areas online within days despite massive destruction. Hurricane Katrina (U.S. Gulf Coast, 2005) flooded transmission and distribution infrastructure causing extended outages across Louisiana and Mississippi, prompting permanent changes including elevated equipment, strengthened structures, and improved vegetation management reducing future storm impacts.
Case Study: Hurricane Maria - Puerto Rico (2017)
Pre-Disaster Conditions and Vulnerabilities:
Puerto Rico Electric Power Authority (PREPA) operated aging infrastructure with deferred maintenance, limited vegetation management, and minimal hurricane hardening despite island's exposure to Atlantic hurricane tracks. System relied heavily on centralized fossil fuel generation in coastal areas vulnerable to storm surge, with transmission lines crossing mountainous terrain susceptible to wind damage and landslides. Weak fiscal condition prevented necessary investments, while monopoly structure reduced innovation and efficiency incentives.
Hurricane Impact (September 20, 2017):
Category 4 hurricane with 155 mph winds and extensive rainfall caused catastrophic damage:
• Transmission system: 80% of transmission lines damaged, hundreds of towers collapsed
• Generation: All major power plants offline due to transmission isolation or direct damage
• Distribution: Nearly 100% of distribution infrastructure damaged, affecting 1.5 million customers
• Communications: Loss of SCADA, radio systems preventing damage assessment and coordination
• Access: Impassable roads, destroyed bridges preventing equipment and personnel movement
• Fuel supply: Port damage, distribution disruption limiting generator operations
Response and Recovery Challenges:
Recovery required 11 months to restore 95% of customers, among longest outages in modern history:
• Delayed damage assessment due to communications loss, access constraints
• Material shortages requiring long-distance procurement and maritime transport
• Workforce limitations with local crews displaced, mutual aid complicated by island logistics
• Funding constraints requiring federal assistance, complex approval processes
• Prioritization disputes between technical optimization and political considerations
• Contractor coordination with multiple entities working simultaneously causing conflicts
Long-Term Resilience Investments and Reforms:
Disaster prompted fundamental transformation of Puerto Rico's energy system:
• Grid modernization: USD 10+ billion investment in transmission/distribution hardening
• Distributed generation: Aggressive microgrid deployment for critical facilities and communities
• Renewable energy: Solar+storage projects reducing fossil fuel dependence, improving resilience
• Regulatory reform: New energy bureau establishing performance standards, enabling competition
• Emergency planning: Improved mutual assistance, pre-positioned materials, communications redundancy
• Vegetation management: Systematic right-of-way clearing reducing tree-related outages
Key Lessons: Avoid deferred maintenance accumulating vulnerabilities, invest in distributed generation providing islanding capability, maintain redundant communications for coordination, pre-position materials enabling rapid response, establish mutual assistance before disasters occur, conduct regular drills testing plans and identifying gaps, incorporate resilience into design standards rather than relying on reactive repairs.
Case Study: Great East Japan Earthquake and Tsunami (2011)
Disaster Scenario and Immediate Impacts:
Magnitude 9.0 earthquake followed by tsunami up to 40 meters high struck northeastern Japan on March 11, 2011, causing unprecedented damage to energy infrastructure and triggering Fukushima Daiichi nuclear disaster. Immediate grid impacts included:
• 4.4 million households (8 million people) lost power across Tohoku and Kanto regions
• Multiple thermal and nuclear power plants tripped offline or damaged
• Transmission infrastructure damaged by earthquake shaking and tsunami inundation
• Fuel supply disruption with refineries offline, port damage preventing deliveries
• Rolling blackouts in Tokyo to manage 20% generation deficit from offline plants
Effective Response Elements:
Despite massive destruction, most power restored within one week demonstrating effective response:
• Rapid assessment: Helicopter surveys, automated SCADA data identifying damage extent
• Prioritized restoration: Critical loads first, systematic circuit-by-circuit progression
• Resource mobilization: 11 utilities nationwide sent 10,000+ workers and equipment
• Temporary power: Mobile generators, rapid grid connections for emergency facilities
• Public communication: Regular updates on restoration progress, energy conservation appeals
• Load management: Coordinated demand reduction preventing further outages
Long-Term Changes and Improvements:
• Nuclear policy revision: Enhanced safety standards, backup power requirements, stress tests
• Renewable acceleration: Feed-in tariffs spurring solar/wind deployment reducing nuclear dependence
• Energy efficiency: Major conservation efforts reducing baseline demand and peak loads
• Distributed generation: Microgrid initiatives providing local resilience
• Interconnection strengthening: Enhanced transmission between regions enabling mutual support
• Emergency planning: Revised protocols incorporating tsunami-specific measures, backup power requirements
Indonesian Relevance: Japan's tsunami exposure and volcanic activity create parallels with Indonesia requiring similar resilience measures including coastal infrastructure elevation, seismic design standards, distributed generation for remote areas, and regional cooperation enabling mutual assistance during disasters.
Frequently Asked Questions
Q: How much does it cost to make power infrastructure resilient to natural disasters, and is it economically justified?
A: Resilience investment costs vary dramatically based on hazard type, asset vulnerability, and protection level required. World Bank analysis finds targeted hardening of exposed assets increases power sector capital costs 3-6% (USD 9-27 billion annually globally) while reducing damage risk by factor of 2-3, often cost-effective when considering avoided damage and service interruptions. Comprehensive hardening regardless of exposure location requires 30% cost premium (USD 96-296 billion) generally not economically justified, highlighting importance of risk-based prioritization. For specific measures: transmission tower strengthening adds 10-15% cost but reduces wind failures 50%; flood barriers for substations cost 3-7% more providing complete protection; undergrounding distribution costs 300-500% more eliminating 90% of storm outages. Economic evaluation should include avoided repair costs, reduced service interruption losses typically valued at USD 5-100 per kWh unserved depending on customer type, and non-market benefits including public health and safety. Many investments appear uneconomic under current conditions but justified considering climate change increasing hazard frequencies or higher economic values from electrification increasing interruption costs.
Q: What are most effective strategies for maintaining power to hospitals and critical facilities during multi-day grid outages?
A: Maintaining critical facility power during extended outages requires multi-layered approach combining backup generation, energy storage, and fuel independence. Hospitals and essential services should install microgrid systems integrating solar PV (200-500 kW typical), battery storage (4-12 hours at reduced load), and backup generators (diesel or natural gas) enabling islanded operation when grid fails. Sizing should support critical loads including life support equipment, refrigeration for medications and blood products, emergency lighting, communications, and essential HVAC for operating rooms and patient areas, typically 30-50% of total facility load. Initial investment ranges USD 3,000-8,000 per kW depending on storage duration and generation mix, with operating costs USD 20-60 per kW annually primarily battery replacement reserves and minimal fuel. System provides grid-connected benefits reducing utility bills USD 50-150 per kW annually through demand charge reduction and time-of-use optimization, achieving 10-15 year payback on economic benefits alone while providing essential resilience. Alternative approach uses larger diesel generators (lower capital cost USD 300-600/kW) but requires reliable fuel supply, creates noise and emissions, and lacks grid-connected economic benefits. Pre-positioned mobile generators provide temporary solution but require manual connection, fuel logistics, and personnel availability creating operational challenges during disasters.
Q: How can developing countries like Indonesia balance resilience investments with limited budgets and competing infrastructure needs?
A: Resource-constrained contexts require strategic prioritization maximizing resilience per dollar invested through several approaches: (1) Risk-based targeting focusing investments on highest-exposure assets (coastal areas, seismic zones) and highest-consequence facilities (hospitals, water treatment) rather than system-wide hardening, achieving 80% of benefits with 20% of comprehensive hardening costs. (2) Resilience-by-replacement incorporating enhanced standards when existing infrastructure reaches end-of-life requiring replacement anyway, minimizing incremental costs to 3-7% versus 30-50% for premature replacement. (3) Nature-based solutions using mangroves, wetlands, and forests providing flood protection, windbreaks, and landslide prevention at fraction of engineered solution costs while delivering co-benefits including biodiversity, carbon storage, and livelihoods. (4) Distributed generation prioritizing off-grid and weak-grid areas where renewable microgrids provide new access and resilience simultaneously, avoiding sequential investments in grid extension then resilience. (5) Community-based preparedness training local electricians, pre-positioning basic materials, and establishing emergency protocols achieving substantial resilience improvements with minimal capital investment. (6) Development finance leveraging World Bank, Asian Development Bank, Green Climate Fund, and bilateral assistance providing concessional lending or grants for climate adaptation including energy resilience, multiplying scarce domestic resources. (7) Public-private partnerships transferring resilience obligations to private operators through performance contracts incentivizing cost-effective solutions, combining private innovation with public oversight and risk sharing.
Q: What role can renewable energy play in disaster resilience compared to traditional fossil fuel backup generation?
A: Renewable energy with storage offers several resilience advantages over conventional diesel generators: (1) Fuel independence eliminating dependence on potentially disrupted supply chains, critical when roads damaged or ports closed preventing fuel deliveries for days or weeks. (2) Rapid deployment with modular solar and battery systems installable in days versus weeks for permanent generator facilities. (3) Silent operation enabling deployment in residential areas without noise complaints. (4) Multi-day autonomy when properly sized, with battery storage providing 4-12 hours and solar recharging daily versus generators requiring refueling every 8-24 hours depending on tank size. (5) Grid-connected benefits reducing energy costs during normal operations through self-consumption and demand charge reduction, unlike generators sitting idle except during outages. (6) Lower operating costs with minimal maintenance (solar panel cleaning, occasional battery replacement) versus generators requiring regular servicing, oil changes, and component replacement. However, renewables face limitations including higher initial capital costs (USD 3,000-8,000/kW for solar-storage vs. USD 300-600/kW for diesel), weather dependence reducing solar output during storms when needed most, and geographic constraints in areas with limited solar resources or space for installations. Optimal resilience often combines both technologies: renewables providing routine islanding capability and fuel-free operation for typical 1-3 day outages, with backup generators available for extended events or high-load scenarios exceeding battery capacity. This hybrid approach achieves resilience with acceptable economics while maintaining operational flexibility across diverse failure scenarios.
Q: What are key performance indicators for measuring and improving power system resilience to natural disasters?
A: Comprehensive resilience measurement requires metrics spanning preparedness, response effectiveness, recovery speed, and long-term adaptation: Preparedness indicators: Percentage of critical facilities with backup power (target >95%), days of pre-positioned repair materials on hand (target 30+ days), mutual assistance agreements in place (target regional coverage), emergency drills conducted annually (target quarterly for large utilities), staff trained in emergency procedures (target 100% customer-facing personnel). Response metrics: Time to complete damage assessment (target <24 hours for initial assessment), critical facility restoration time (target <72 hours for hospitals, emergency services), customer communication frequency (target hourly updates during major events), workforce mobilization speed (target mutual aid crews arriving <48 hours after request). Recovery performance: Percentage of customers restored within 3 days (target >50%), within 1 week (target >80%), within 2 weeks (target >95%), SAIDI and SAIFI tracking outage frequency and duration over time showing improvement trends, economic losses from outages (USD per event or annual total), customer satisfaction with restoration efforts. Long-term resilience: Hardening investment levels (target 3-5% of capital budget), vulnerable asset exposure (declining trend as hardening progresses), repeat failure rates (locations experiencing multiple outages indicating unresolved vulnerabilities), insurance claims and costs (declining with effective hardening), lessons learned implementation (percentage of post-event recommendations actually implemented). Climate adaptation: Infrastructure design standards incorporating projected climate changes, scenario planning examining resilience under various futures, monitoring actual climate trends versus projections, adjusting strategies based on emerging evidence. Utilities should benchmark performance against industry standards and peer utilities, publish annual resilience reports ensuring transparency, and continuously improve based on both disaster experiences and proactive testing through drills and simulations.
Conclusions and Strategic Recommendations
Energy infrastructure resilience to natural disasters represents critical global challenge requiring comprehensive approaches integrating physical hardening, distributed generation, emergency planning, rapid response capability, and long-term adaptation to changing risk profiles. Evidence from major disasters worldwide demonstrates that investments in preparedness, well-designed emergency response protocols, and systematic recovery frameworks significantly reduce impacts on public health, economic productivity, and social stability compared to reactive approaches relying solely on post-disaster reconstruction. Indonesian context presents acute challenges given geographic exposure to earthquakes, tsunamis, volcanic eruptions, floods, and tropical cyclones combined with developing economy constraints limiting available resources, dispersed island geography complicating mutual assistance, and infrastructure deficiencies creating baseline vulnerabilities that natural disasters severely exacerbate.
Strategic priorities for Indonesia and similarly situated developing countries should emphasize risk-based targeting focusing scarce resources on highest-exposure assets and highest-consequence facilities achieving disproportionate resilience benefits, distributed renewable energy deployment providing community-level resilience while advancing electrification and climate objectives simultaneously, institutional capacity building training personnel and establishing protocols enabling effective response without requiring external assistance, regional cooperation creating mutual assistance networks enabling workforce and equipment sharing during major events, and international partnership accessing technical expertise and development finance supporting infrastructure investments. These strategies recognize that perfect resilience remains economically infeasible, requiring intelligent prioritization accepting some level of residual risk while protecting most critical functions and vulnerable populations.
Technology trends including declining renewable energy costs, improving battery storage performance, smart grid automation enabling self-healing networks, and advanced monitoring providing early warning all enhance feasibility and cost-effectiveness of resilience investments. However, technology alone proves insufficient without supportive regulatory frameworks establishing standards and incentives, institutional arrangements enabling coordinated action across fragmented responsibilities, adequate financing mechanisms mobilizing necessary capital, and political commitment sustaining long-term programs extending beyond election cycles and disaster memory fading. Climate change intensifying natural hazards creates dynamic risk environment requiring adaptive management periodically reassessing vulnerabilities, updating strategies based on emerging evidence, and maintaining vigilance against complacency during fortunate periods without major disasters.
Looking forward, successful resilience requires shifting from reactive disaster response culture to proactive risk management embedding resilience considerations throughout infrastructure lifecycle from initial planning and design through operations, maintenance, and eventual replacement. This transformation demands changing organizational cultures, developing workforce capabilities, establishing data systems enabling evidence-based decisions, and building public understanding supporting necessary investments and behavioral changes. Ultimate goal extends beyond merely recovering from disasters to building energy systems that anticipate, withstand, and rapidly recover from natural hazards while continuously adapting to evolving risks, serving as foundation for sustainable development, economic prosperity, and social equity in increasingly uncertain climate future facing nations worldwide.
Technical References and Resources
This article draws on authoritative technical resources from leading international organizations, research institutions, and Indonesian agencies working on energy resilience and disaster management. All references have been verified and are accessible for download. Click on the document titles or PDF icons to access the full reports and guidelines.
World Bank & International Development Banks
Stronger Power: Improving Power Sector Resilience to Natural Hazards
Comprehensive analysis of power infrastructure vulnerability and resilience strategies (Primary source)
Download PDF Alternative Link
Strengthening New Infrastructure Assets: A Cost-Benefit Analysis
Economic framework for evaluating resilience investment decisions
Download PDF
International Energy & Disaster Management Organizations
APEC Energy Resiliency Guidelines
Comprehensive framework for energy sector disaster preparedness and recovery
Download PDF
IRENA: Enhancing Resilience of Power Infrastructure
Renewable energy integration for disaster-resilient power systems
Download PDF
Disaster Recovery Framework Guide for Energy Sector
ReliefWeb/OCHA practical guide for energy sector disaster recovery
View Online
Protecting Electricity Networks from Natural Hazards (OSCE)
European standards for power infrastructure protection against natural disasters
Download PDF
U.S. Government & Research Institutions
Microgrids for Disaster Preparedness and Recovery
PREPARE Center comprehensive guide on microgrid deployment for resilience
Download PDF
Model Guidelines for Energy Efficiency in Emergencies
U.S. Department of Energy emergency planning guide
Download PDF
Power Grid Recovery After Natural Hazard Impact (JRC EU)
European Commission Joint Research Centre technical analysis
Download PDF
Indonesia Case Studies & Research
Emergency Energy Provision Post Flash Flood - Pesisir Selatan
Universitas Andalas case study on disaster response in West Sumatra
Download PDF
Role of Renewable Energy Standards as Early Response System
Indonesian standards for renewable energy in post-earthquake/tsunami response
View Online
Technology-Based Post-Disaster Reconstruction Management
UKI Jakarta - comprehensive framework for disaster reconstruction
Download PDF
Additional Industry Resources
Lights Out: Risks of Climate and Natural Disaster to Power
Swiss Re insurance industry perspective on power sector climate risks
Download PDF
Disaster Recovery & Contingency Power Planning
Industry guide for business continuity and emergency power systems
Download PDF
Note: All references have been verified as of December 2024. These documents represent international best practices, technical standards, and case studies from authoritative sources in energy resilience and disaster management. For the most current versions and additional resources, please visit the respective organization websites. Documents are provided in PDF format unless otherwise noted and are freely accessible for educational and professional purposes.

Professional Energy Resilience and Disaster Preparedness Consulting
SUPRA International provides comprehensive consulting services for energy system resilience planning, disaster preparedness, and infrastructure hardening. Our multidisciplinary team supports government agencies, utilities, infrastructure developers, and international organizations with natural hazard vulnerability assessments and risk mapping, power sector resilience strategy development, emergency preparedness planning and exercise design, distributed generation and microgrid feasibility studies, infrastructure hardening design and cost-benefit analysis, renewable energy integration for disaster resilience, emergency power system design and deployment protocols, disaster recovery framework development, regulatory compliance and standards implementation, climate adaptation planning for energy infrastructure, and training programs for emergency response teams. We combine international best practices with deep understanding of Indonesian context including geographic hazards, regulatory frameworks, institutional capabilities, and infrastructure conditions to deliver practical, implementable solutions enhancing energy system resilience against earthquakes, tsunamis, floods, volcanic eruptions, and other natural hazards affecting tropical archipelagic nations.
Need expert guidance on energy resilience strategies and disaster preparedness planning?
Contact us to discuss your energy infrastructure protection and emergency response requirements
Share:
If you face challenges in water, waste, or energy, whether it is system reliability, regulatory compliance, efficiency, or cost control, SUPRA is here to support you. When you connect with us, our experts will have a detailed discussion to understand your specific needs and determine which phase of the full-lifecycle delivery model fits your project best.